Change Failure Rate
What percentage of changes to the production environment result in degraded service — defined as a deployment of a new fix version or a rollback to an older version of the application package within 4 hours after the first deployment.
Metric Levels
| Level | Threshold |
|---|---|
| ELITE | Less than 10% |
| HIGH | Between 10% and 25% |
| MEDIUM | Between 25% and 50% |
| LOW | More than 50% |
| BLANK | Not enough data to compute |
Metric Trends
| Trend | Meaning |
|---|---|
| INCREASING | The metric level has been improving in the last month |
| STABLE | The metric level has been stable in the last month |
| DECREASING | The metric level has been deteriorating in the last month |
Example
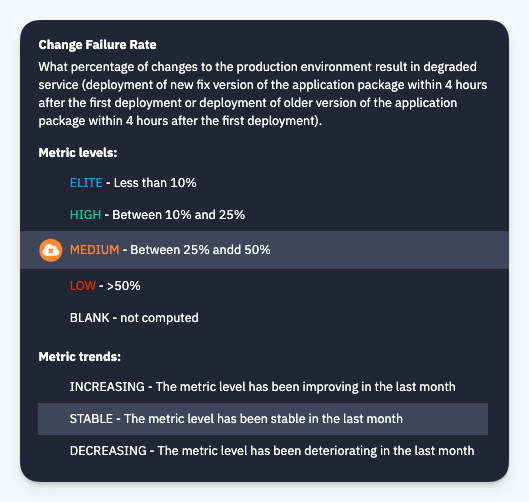
Over the past month, the team deployed 12 times to production. In 4 of those deployments, something went wrong within 4 hours — twice they had to deploy a hotfix version, and twice they rolled back to the previous package. That's 4 out of 12 deployments ending in a recovery action, giving a change failure rate of ~33%. CodeNOW evaluates this as MEDIUM.
The underlying cause was insufficient test coverage for integration scenarios — failures that weren't caught in staging only surfaced under real traffic. Improving automated integration tests and adding a canary deployment step would help push this towards HIGH (below 25%) or eventually ELITE (below 10%).