Cluster List
The Cluster List displays all Dataplanes connected to your account as cards. Each card provides a quick overview of the cluster's health and current resource utilization.
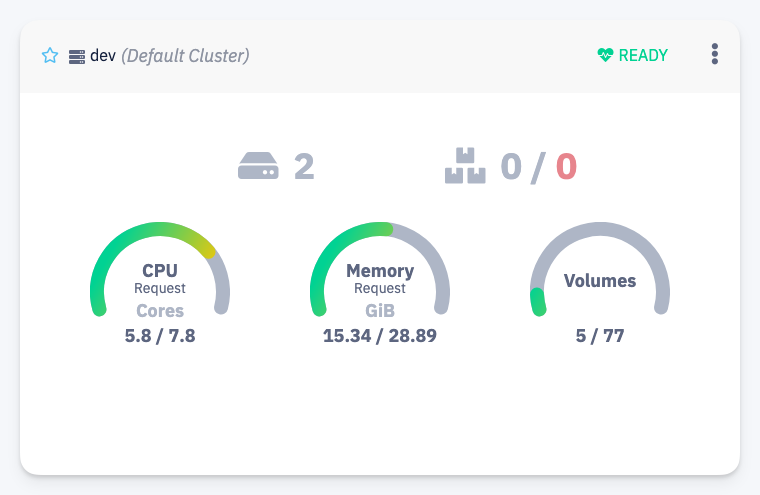
Cluster Card
Each card shows the following information:
Header
- Name — the cluster name, optionally marked as (Default Cluster)
- Status — current readiness of the cluster (e.g. READY)
Resource counters
- Nodes — the number of nodes in the cluster
- Pods without resource requests — the number of pods that do not have CPU or Memory requests defined; shown in red when non-zero
Resource gauges — each gauge shows the requested amount versus the total cluster capacity:
- CPU Request — requested CPU cores across all workloads vs. total available cores
- Memory Request — requested memory (GiB) across all workloads vs. total available memory
- Volumes — number of persistent volumes in use vs. total available
note
The resource gauges reflect requested resources based on workload definitions, not actual real-time consumption. To see live usage metrics, use the cluster monitoring available in the Observability section.