DORA metrics
How well does your software delivery compare with the elite DevOps performers? CodeNOW computes the key performance indicators used by software leaders. Those indicators, the DORA metrics, help software managers identify areas for improvement where to focus their engineering efforts.
The DORA performance metrics
The DORA metrics originate from six years’ worth of surveys conducted by the DORA (DevOps Research and Assessments) research team. The research team identified four metrics that correlate with software delivery performance: deployment frequency, mean lead time for changes, mean time to recover and change failure rate.
The metrics come with benchmarks that locate an engineering team in one of the Elite, High, Medium, and Low performer categories. Tracking the metrics over time gives engineering teams a measure of how well or how fast their software delivery process is improving.
CodeNOW currently tracks these metrics:
- Deployment frequency
- Lead time for changes
- Change failure rate metrics
The metrics allow comparing software delivery performance against the DORA benchmark. Elite performers (e.g., Netflix, Amazon) for instance deploy daily (deployment frequency > 1 time/day) and have a change failure rate below 10%.
The metrics are displayed in application cards (Application Development > Applications). For a thorough understanding of the metrics and how they correlate to the performance of software delivery, please refer to Google's explanatory article.
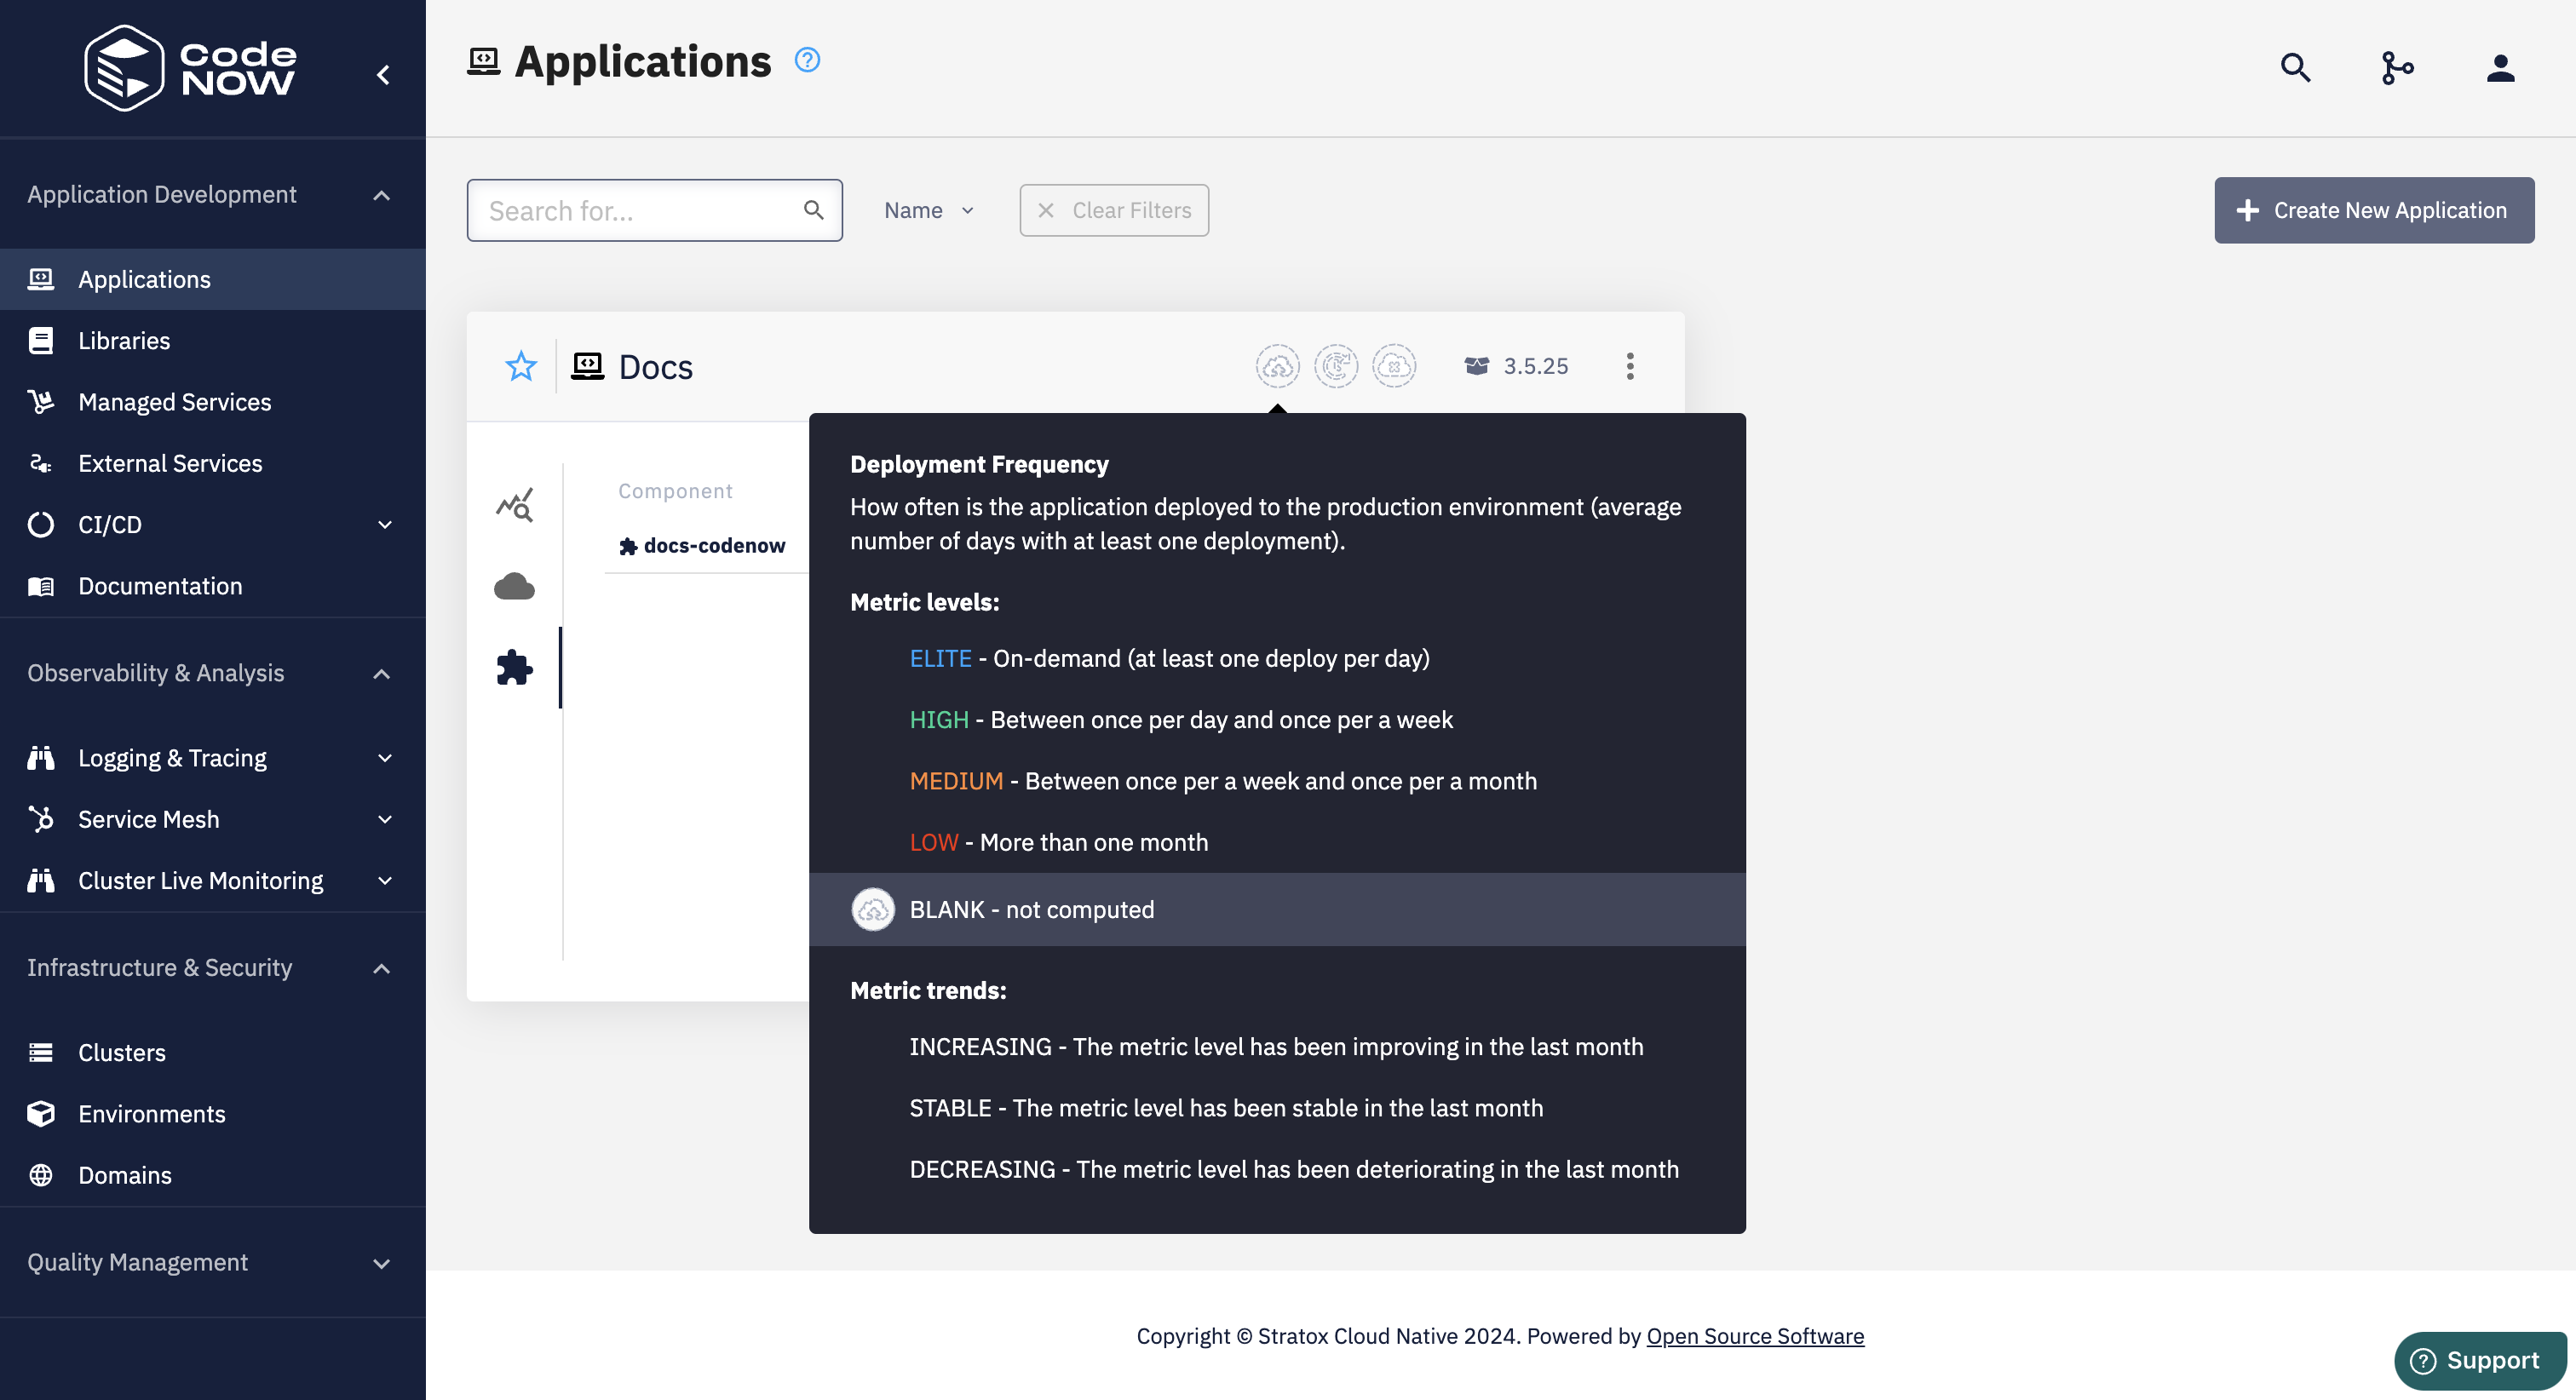
Deployment Frequency
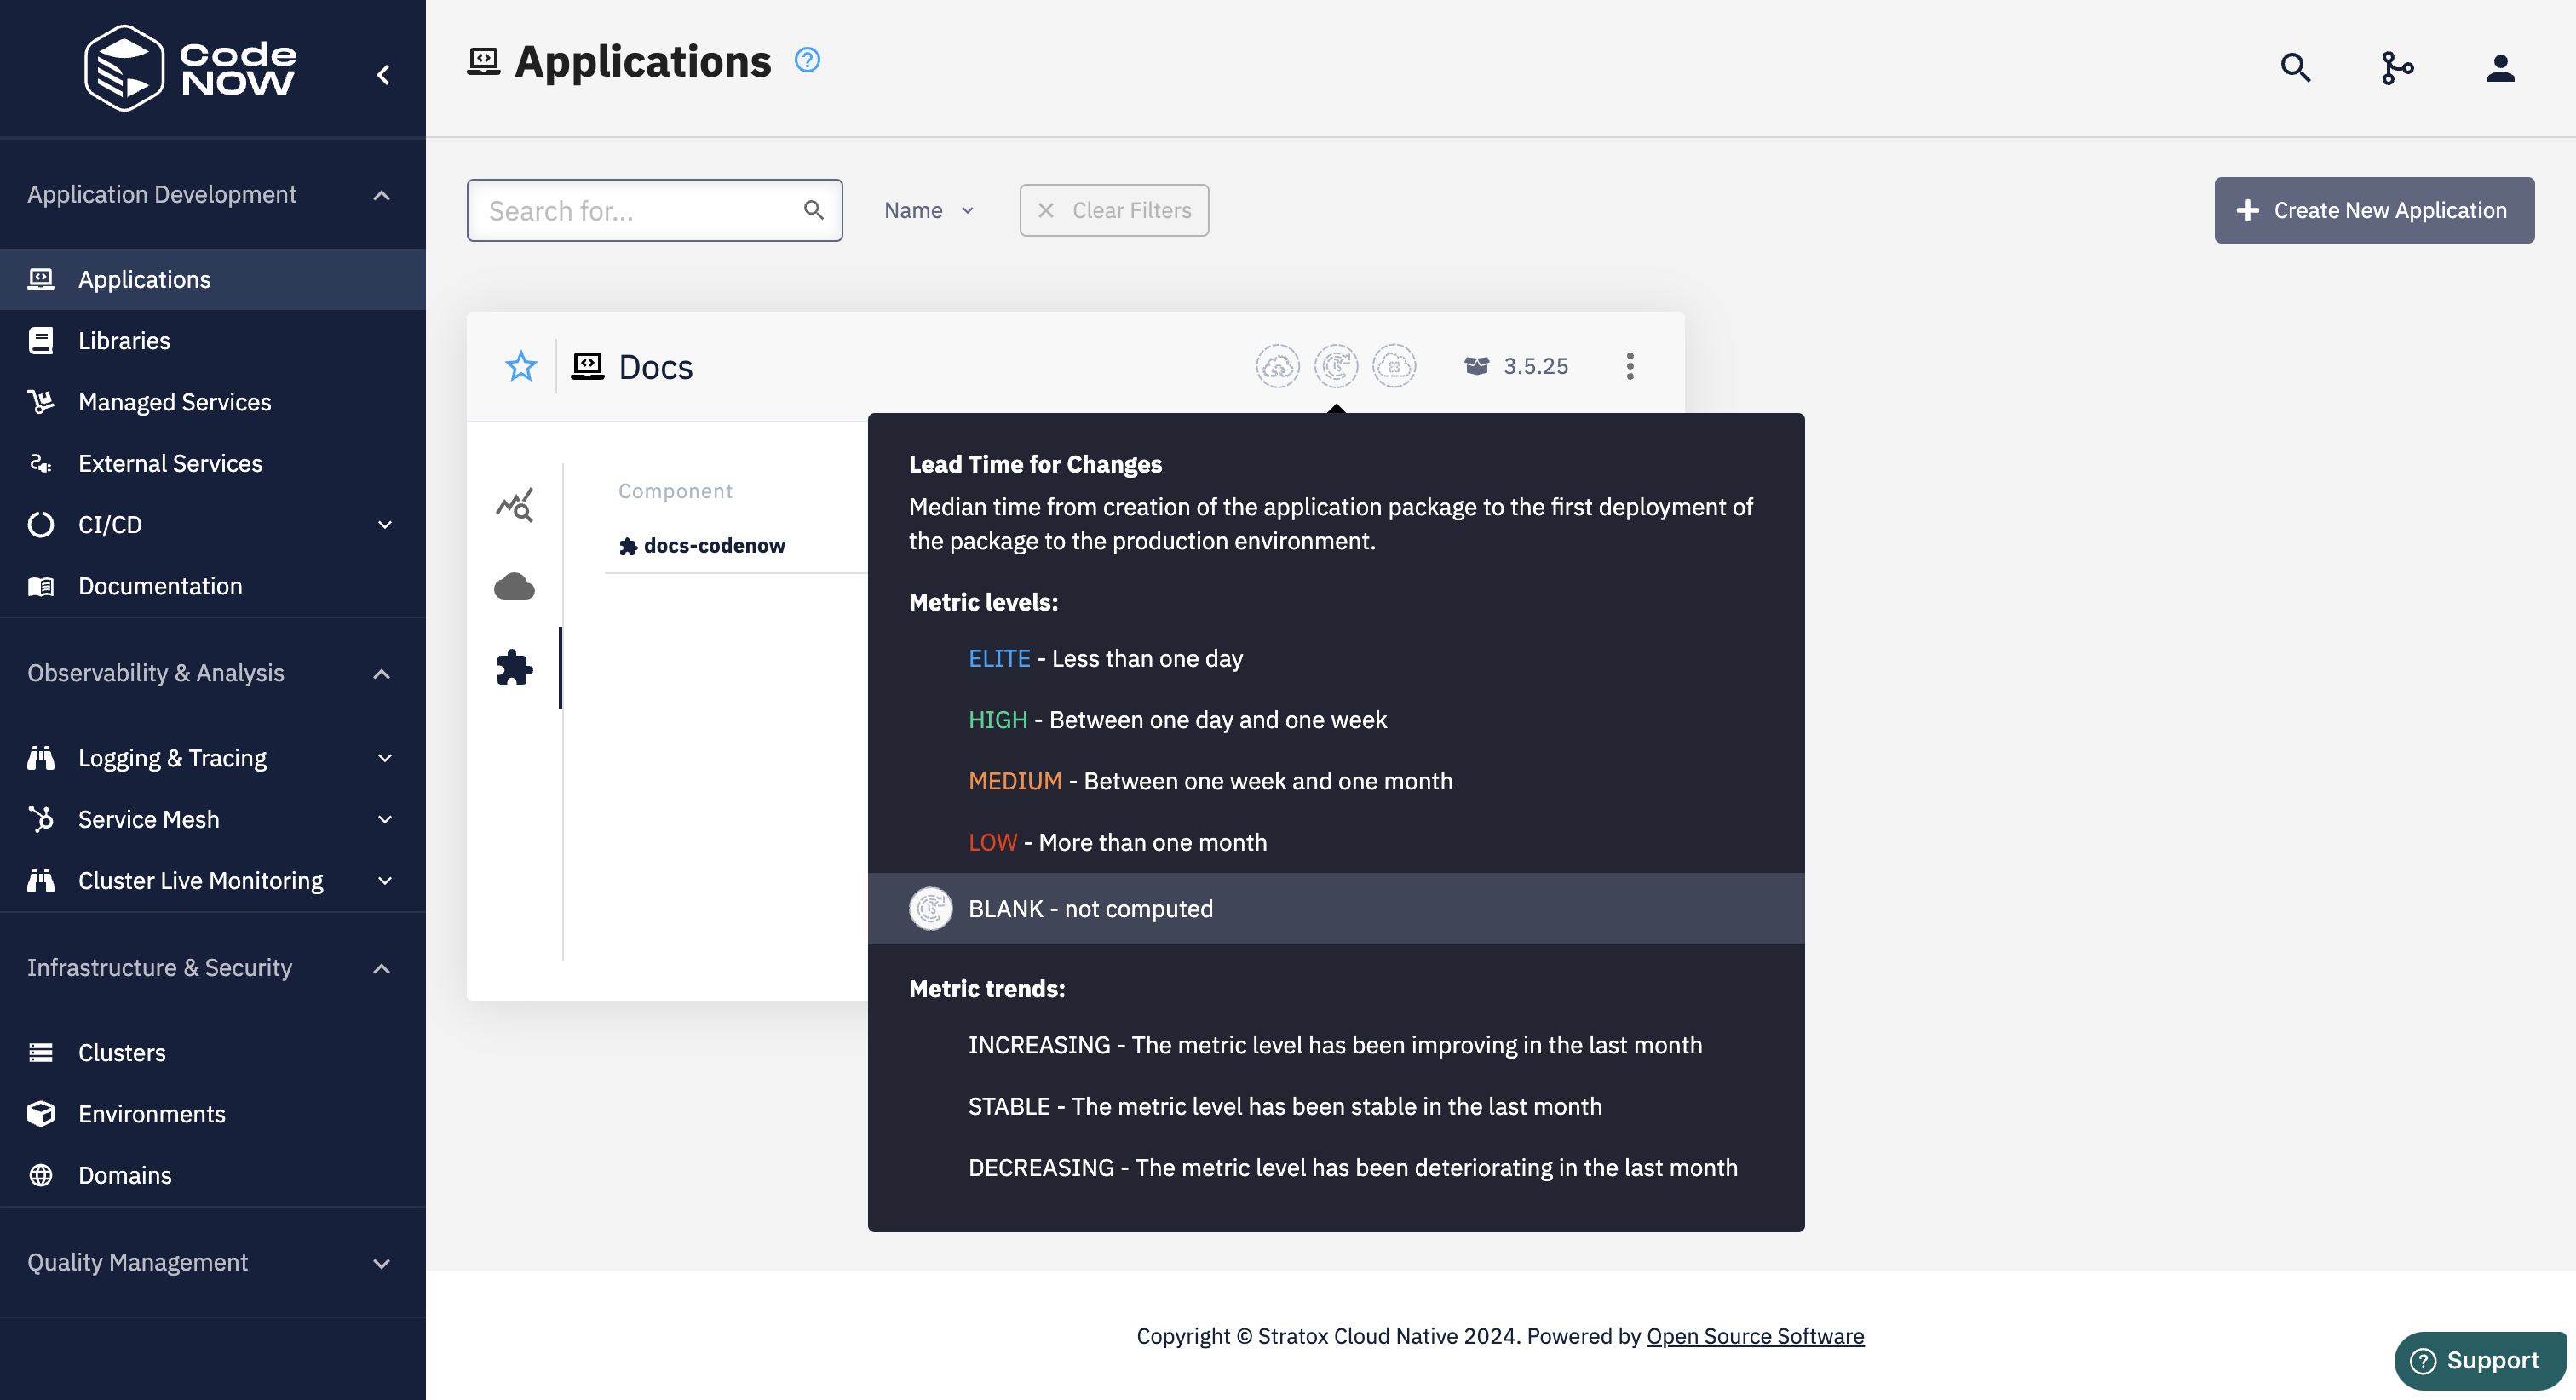
Lead time for changes
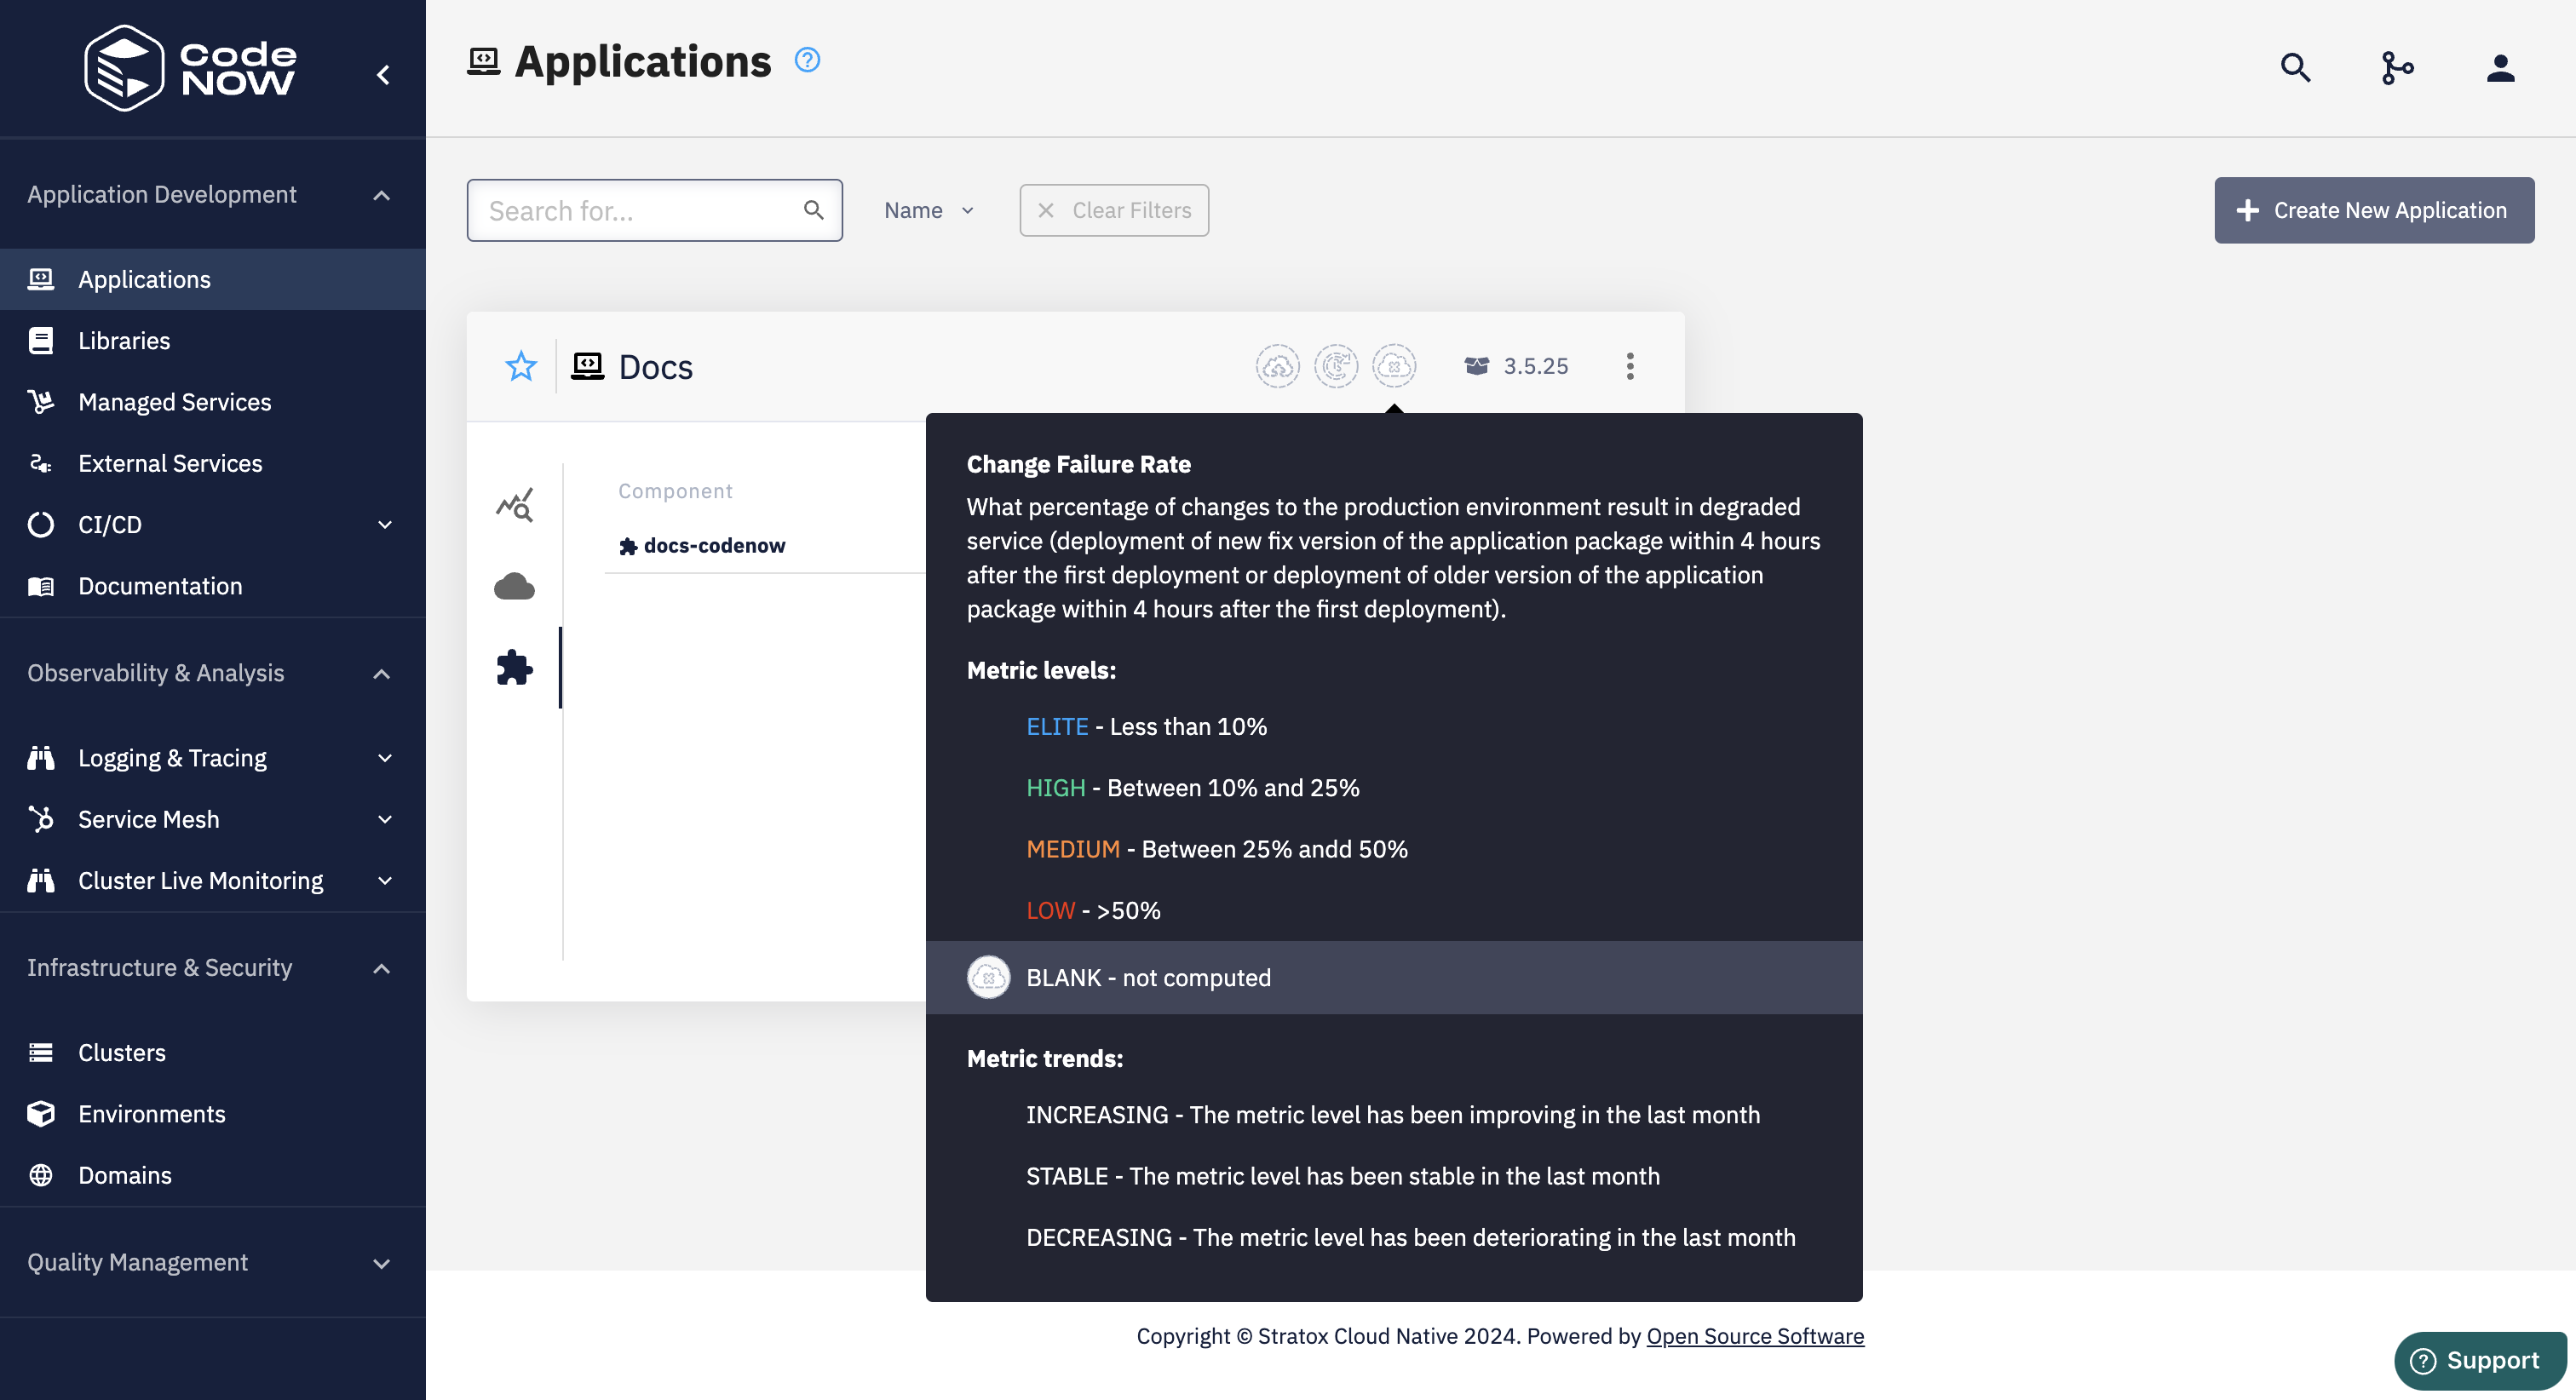
Change Failure Rate