API Execution/Testing with Swagger
🕓 10 minutes
What you’ll learn
How to execute components APIs and see the responses after the application deployment.
Before you begin
Steps
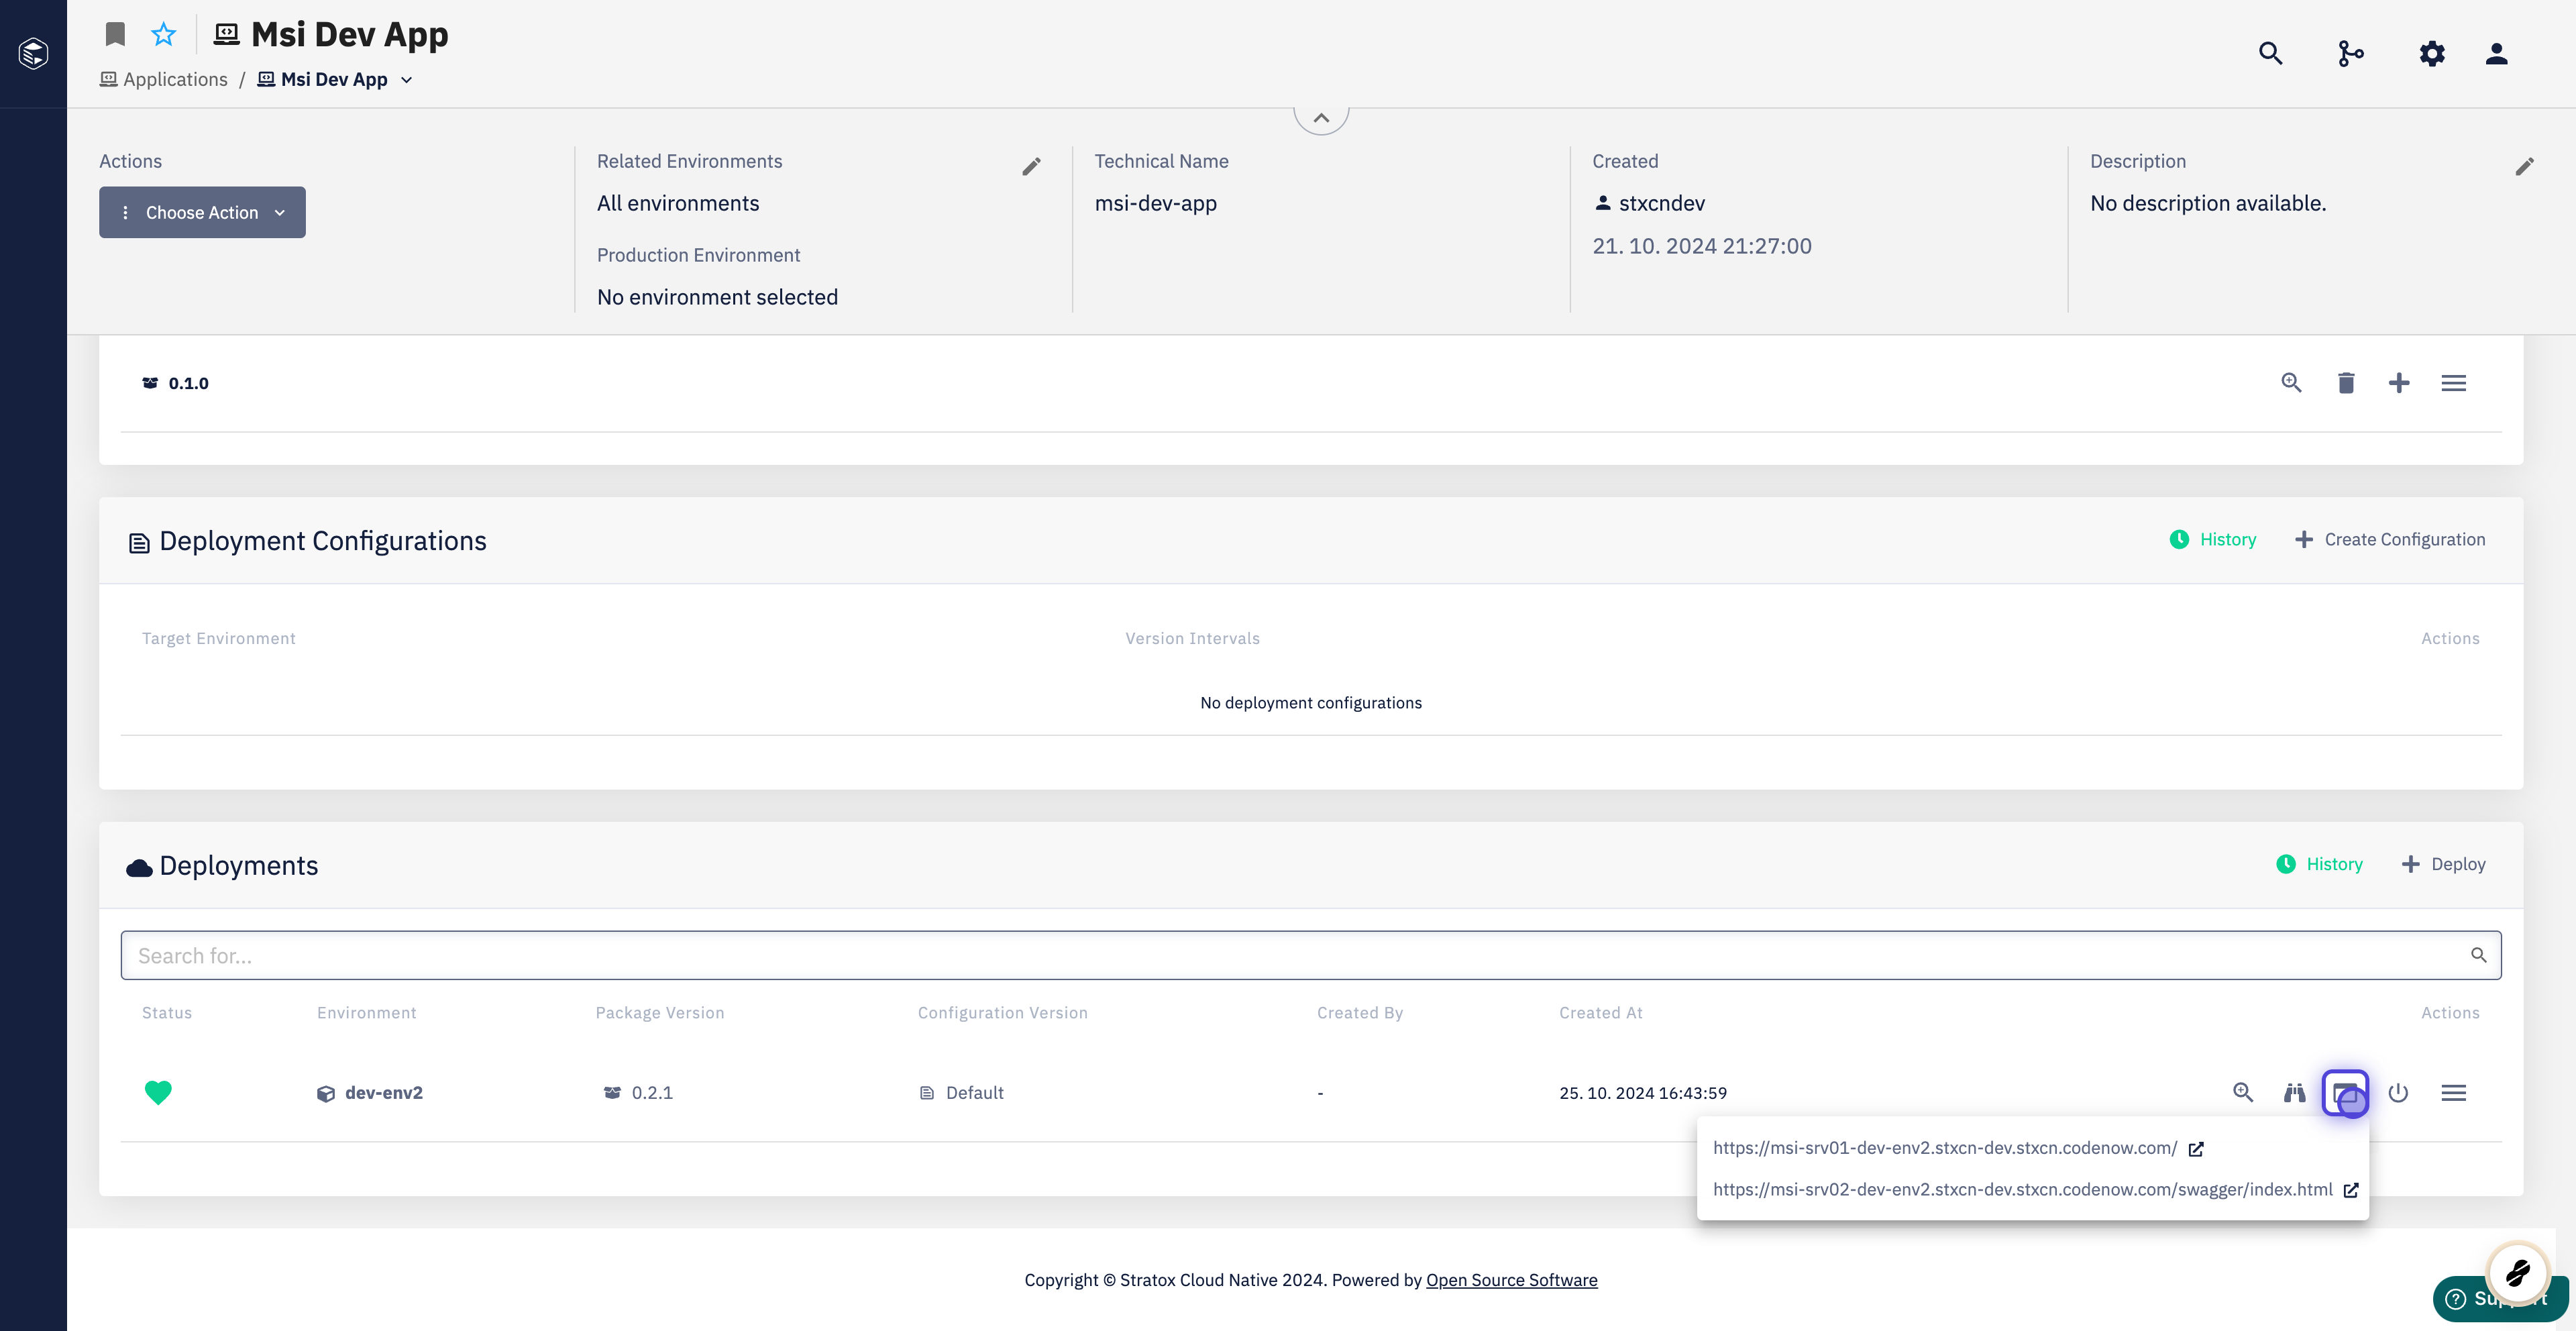
- See the application detail. Under Deployments, select Endpoints.
- Choose the endpoint that ends with
swagger-ui/index.html. - Execute your API’s by the integrated Swagger UI tool
- In case you don't know Swagger, the video on this page may help you understand its basic usage.
- Often you are looking for traceID from the response header. This traceID, e.g., helps you analyze interactions in distributed tracing systems.
- If your swagger-ui does not reflect the latest changes in your component's API, make sure you modified the swagger.yml file inside your component.
- You can use traceID to see detailed logs of your application.
- To be able to see them, you can go to the Logging and tracing section, choose Logging, select your application and paste your traceID into the Line contains field
- You can also change the time range if you click on the clock icon in the top right corner.
- For more information see Logging
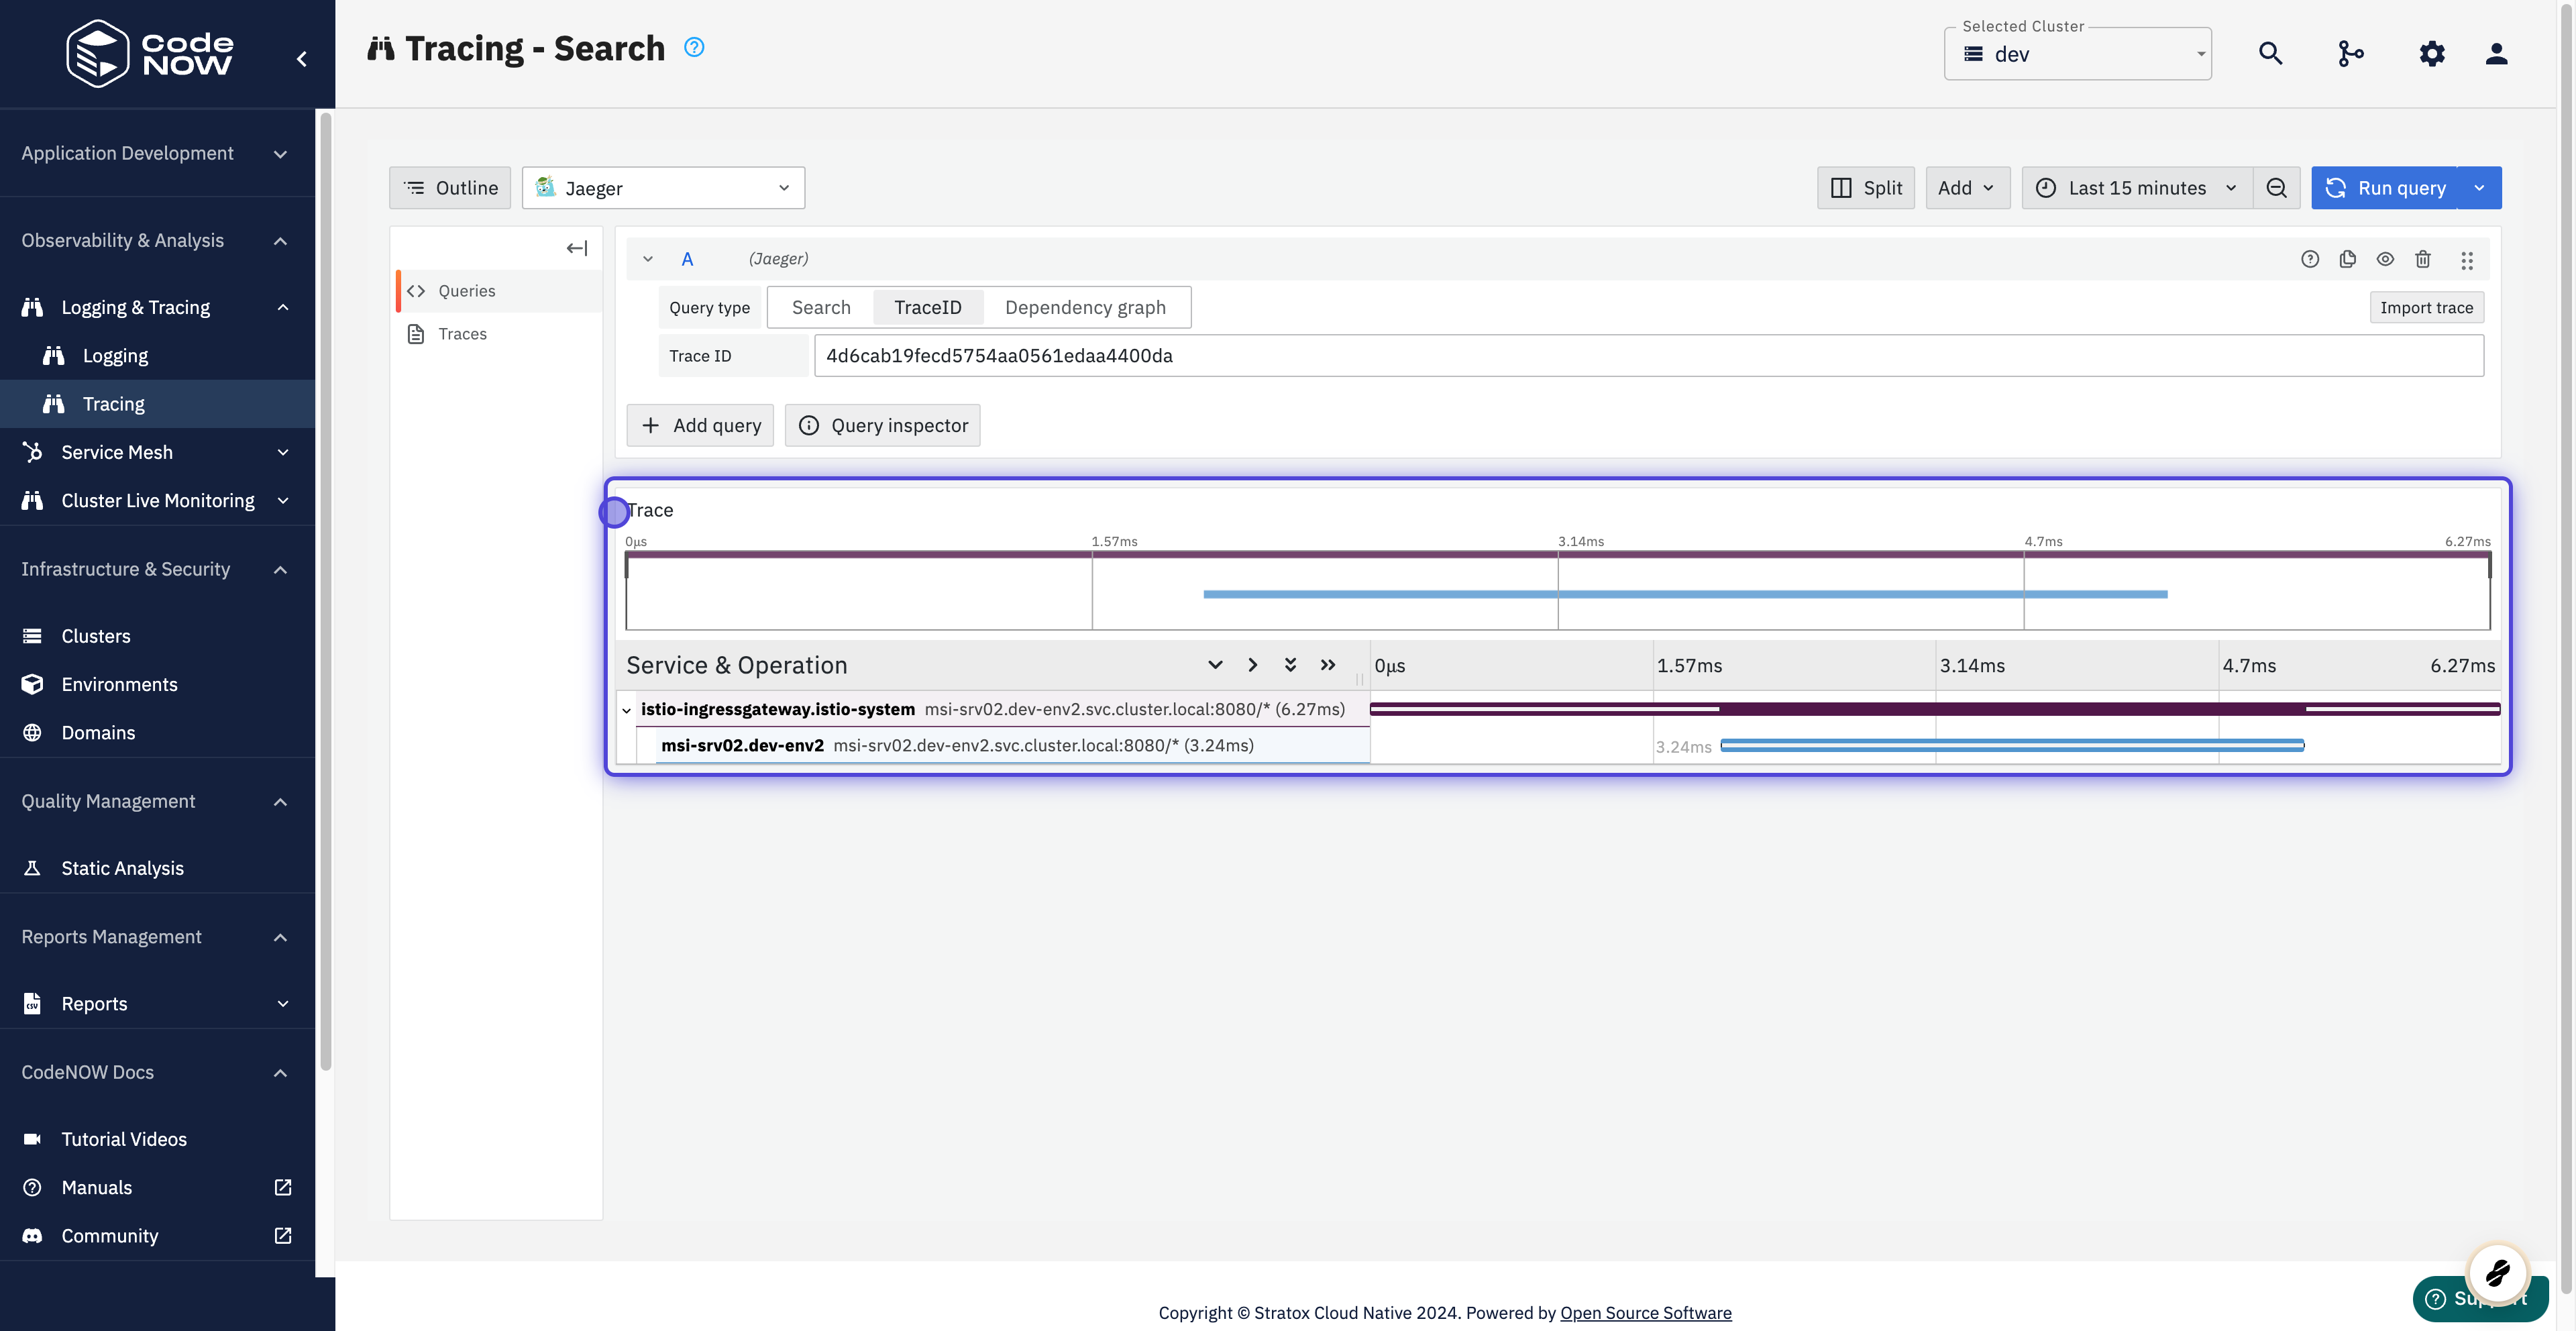
- TraceID is also used for analyzing your tracing system.
- For tracing information, go to the Logging and tracing section, this time choose Tracing and paste your traceID into the input field.
- Here you can see how components interact with each other inside your application.
- For more information see Tracing
Step 1: Find Endpoints

Step 2: Launch Swagger
Step 5: Use traceID in Tracing
1 / 8