Tracing
🕓 10 minutes
What you’ll learn
This tutorial details how to use tracing for monitoring, analyzing, debugging, and optimizing your code. Tracing helps you to:
- detect failures and the place where they occur;
- and understand what causes the poor performance of the application.
Prerequisites
Steps
- Find the "Logging & Tracing" section in the sidebar menu and go to the "Tracing" option.
- Get a
traceIDif you don't have one already. Paste thetraceIDinto the search field and click on the "Run query" button.
note
If you don't know how to get a traceID, see API Execution/Testing with Swagger or Internal documentation.
- Now you can view your trace.
- For details, click on it.
- View more details.
- You can also use the search field to find the specific component. Result will be highlighted in yellow:
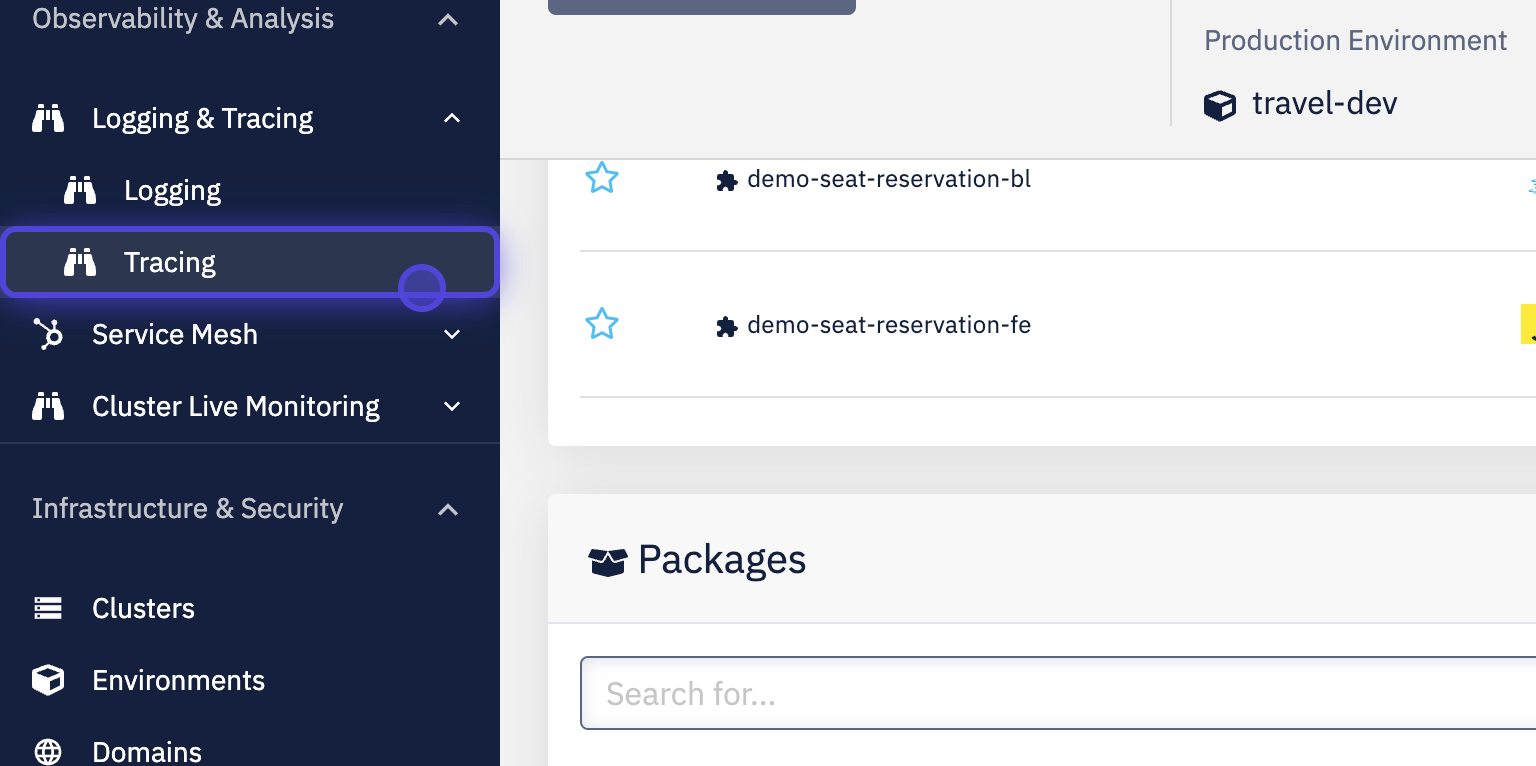
Navigate to Tracing
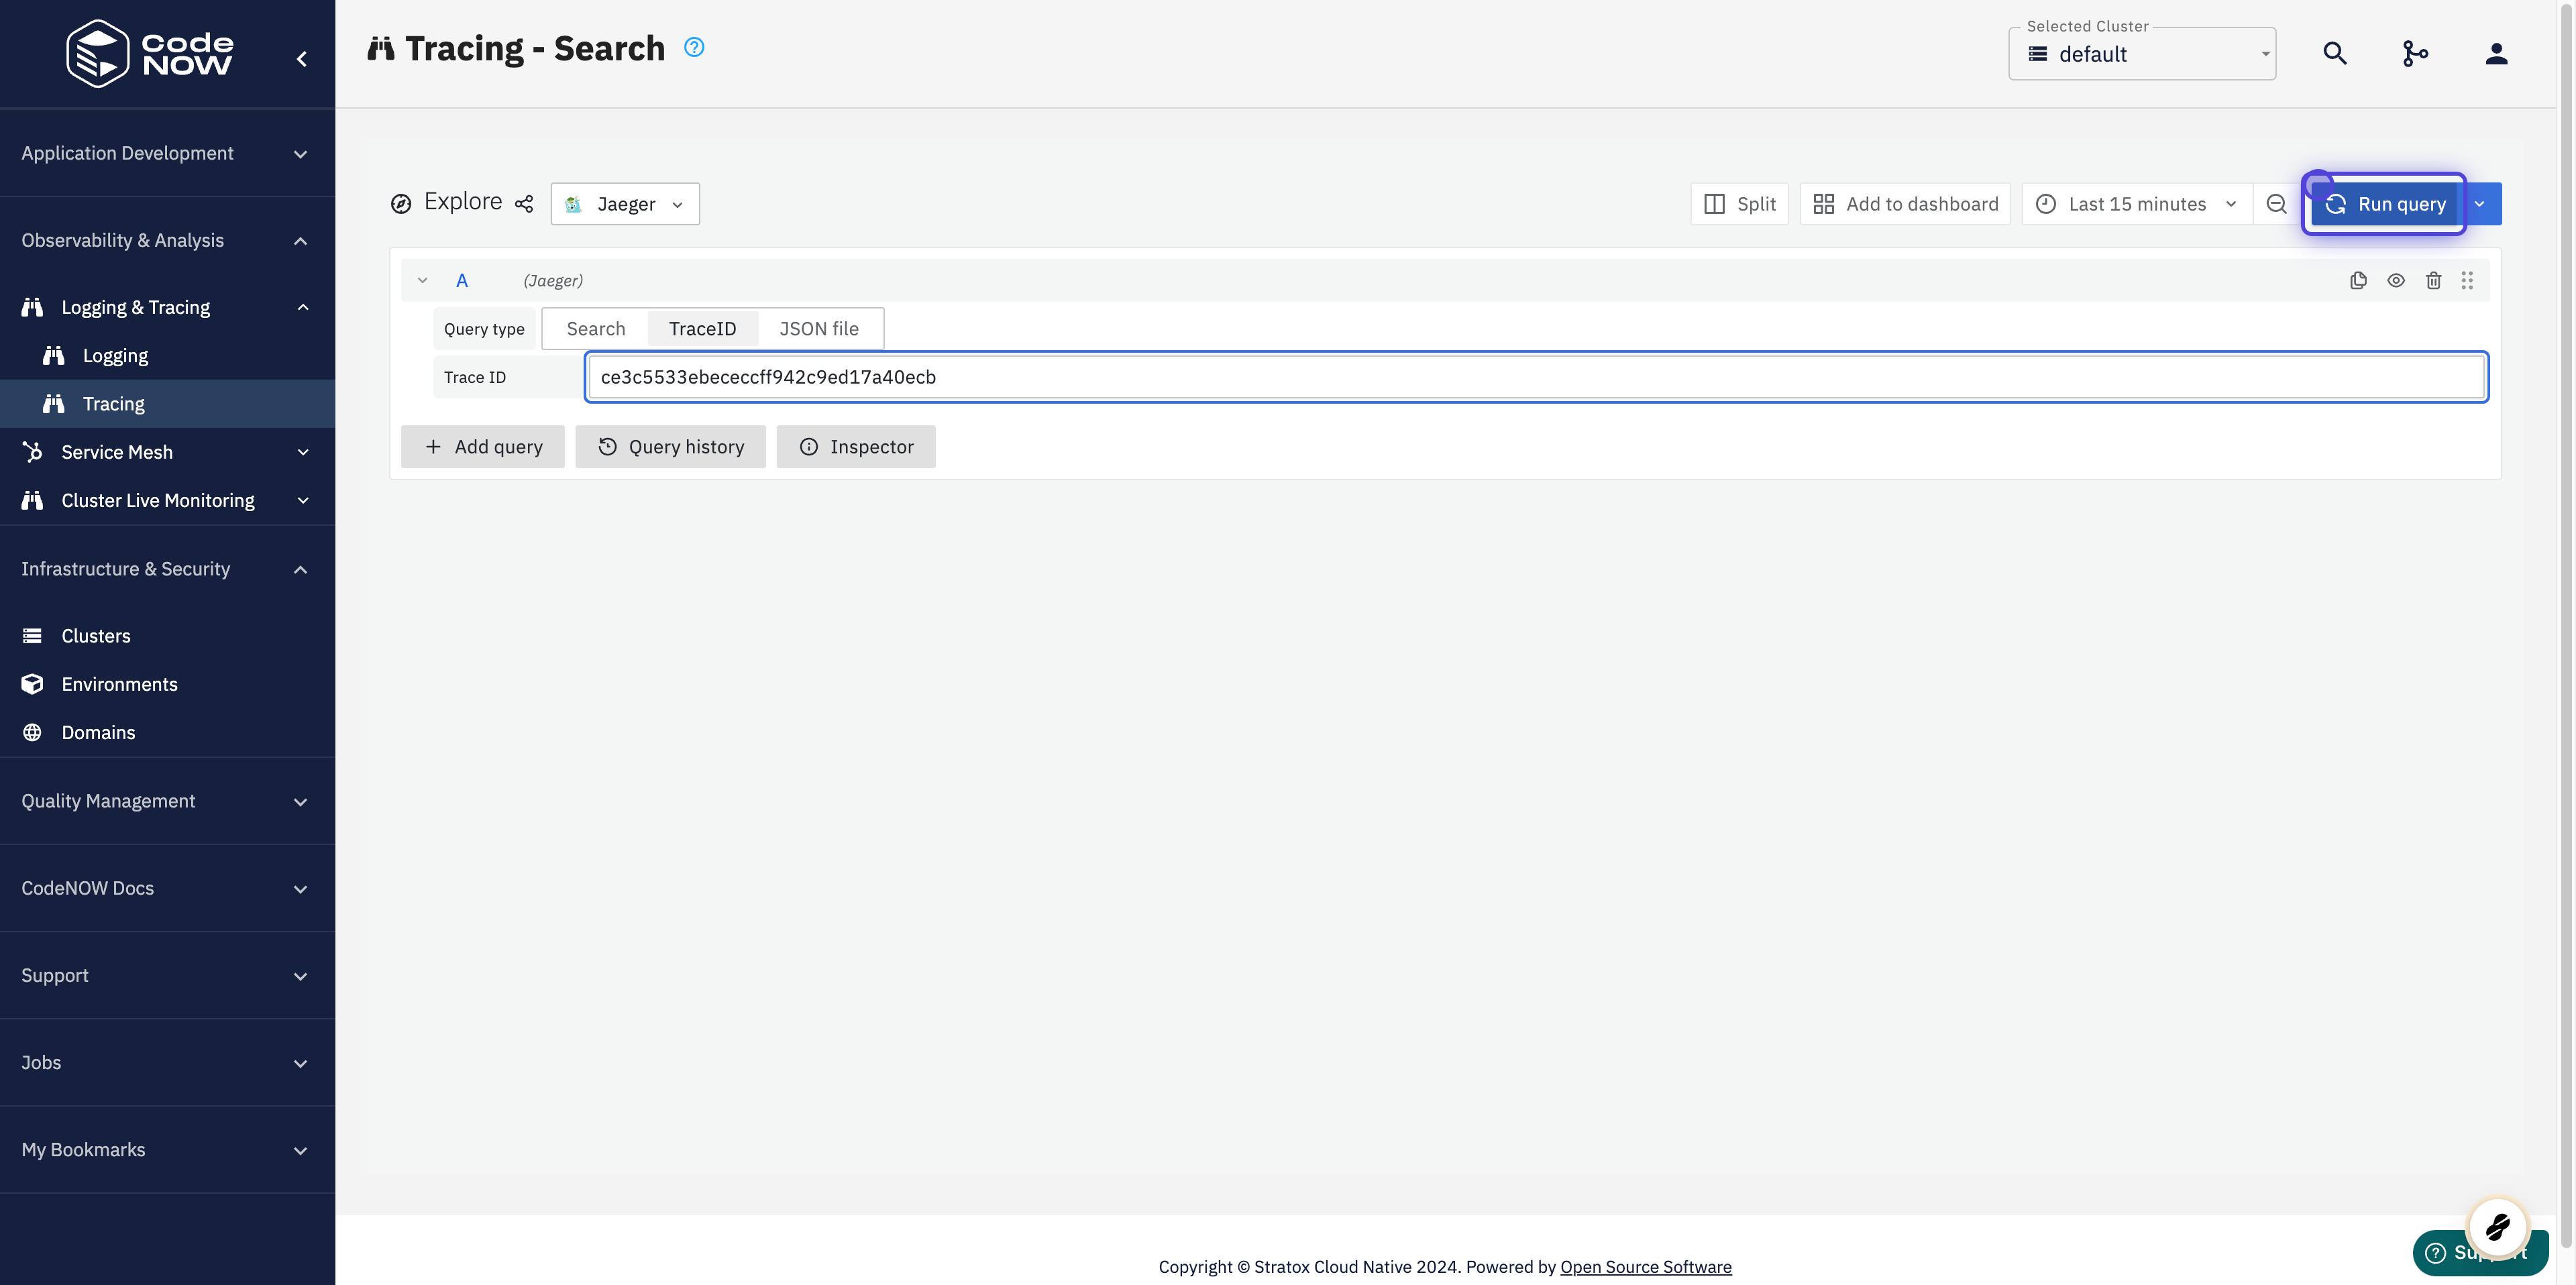
Paste a traceID and Run query
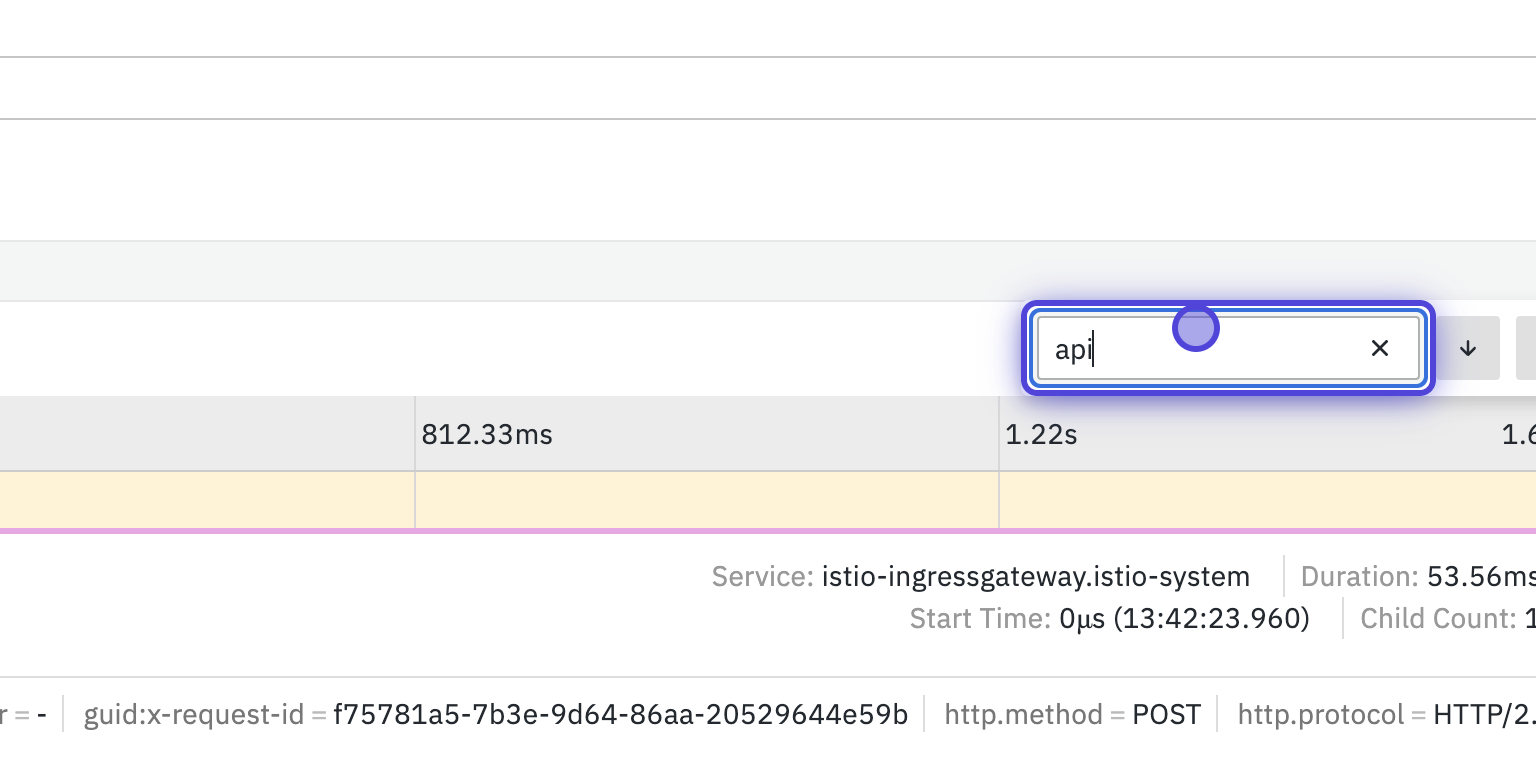
Find function of tracing
1 / 6
tip
Learn more about Jaeger