Live Monitoring with Grafana
🕓 10 minutes
What you’ll learn
How to use the live monitoring of your application or environment to:
- see the memory and cpu allocations,
- investigate the network statistics,
- create high-performance, fast and scalable applications.
Prerequisites
Overview
In CodeNow you are able to live monitor your environment and/or your application.
-
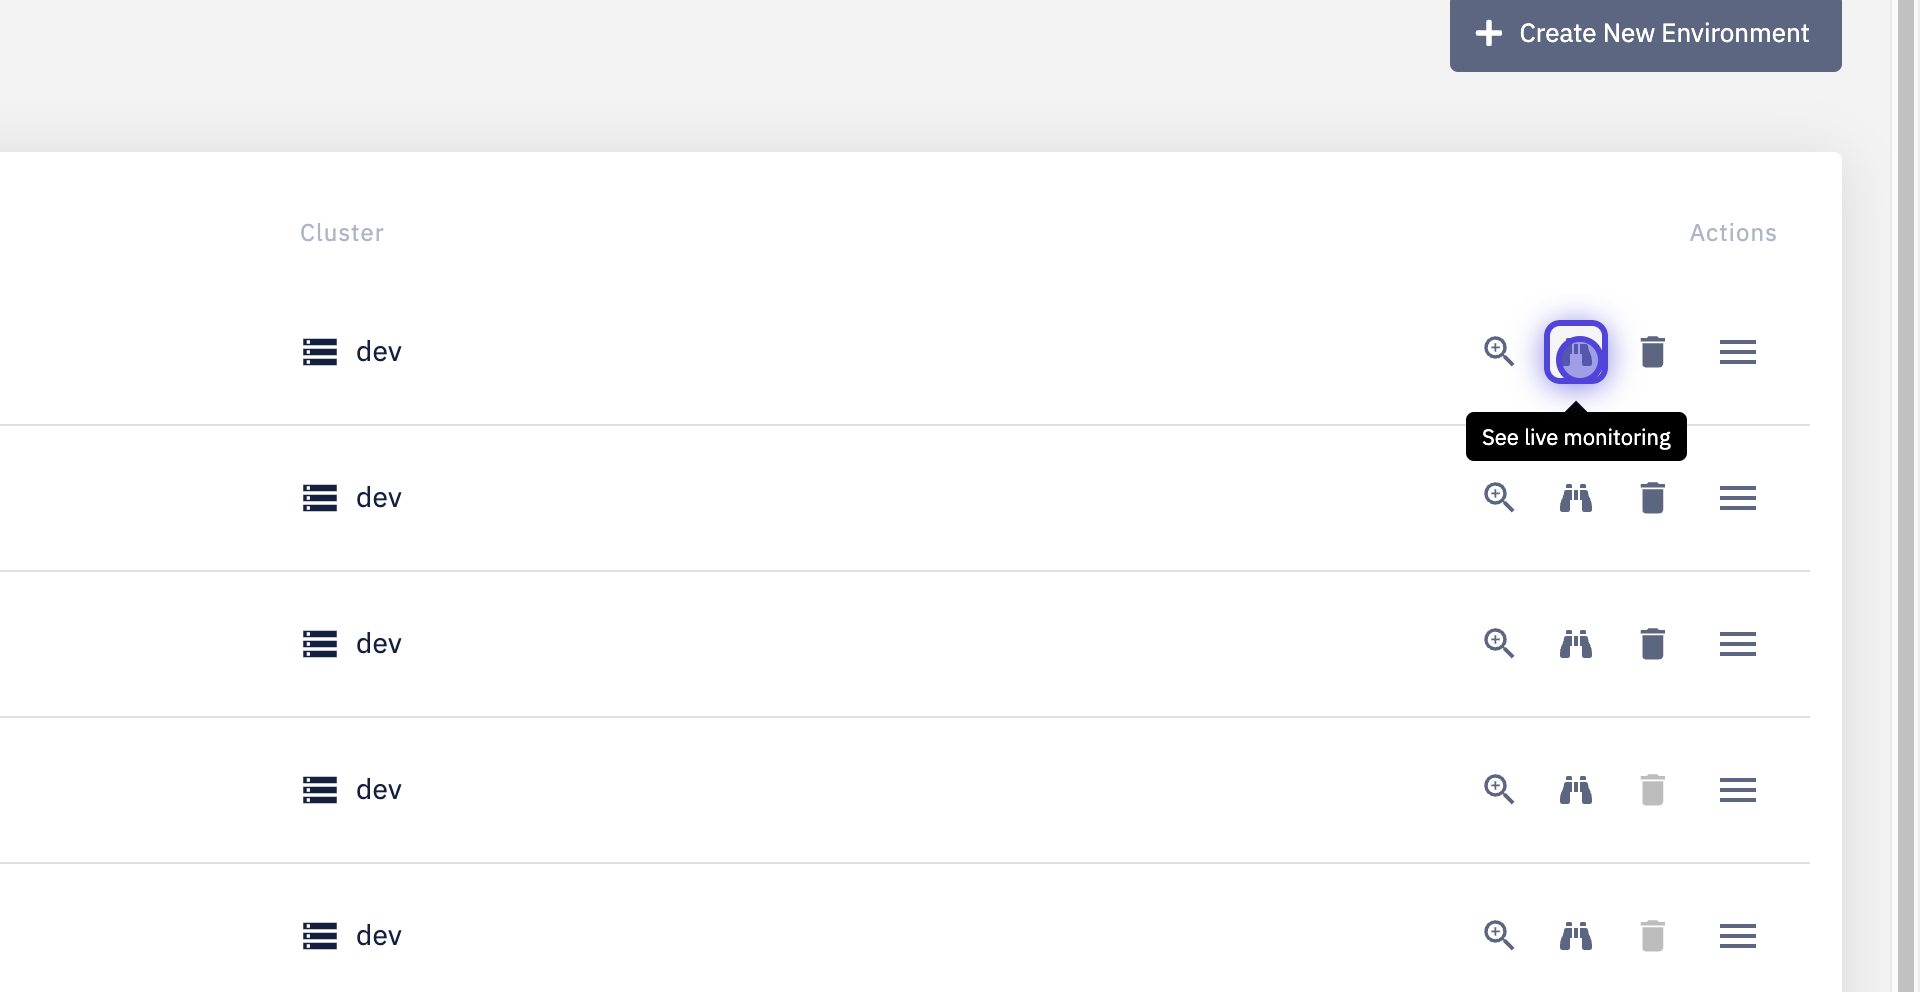
If you want to see the live monitoring of the environment, go to "Environments".
- There, choose the environment, click on the "See live monitoring" button and you will be redirected to the Grafana UI page.

-
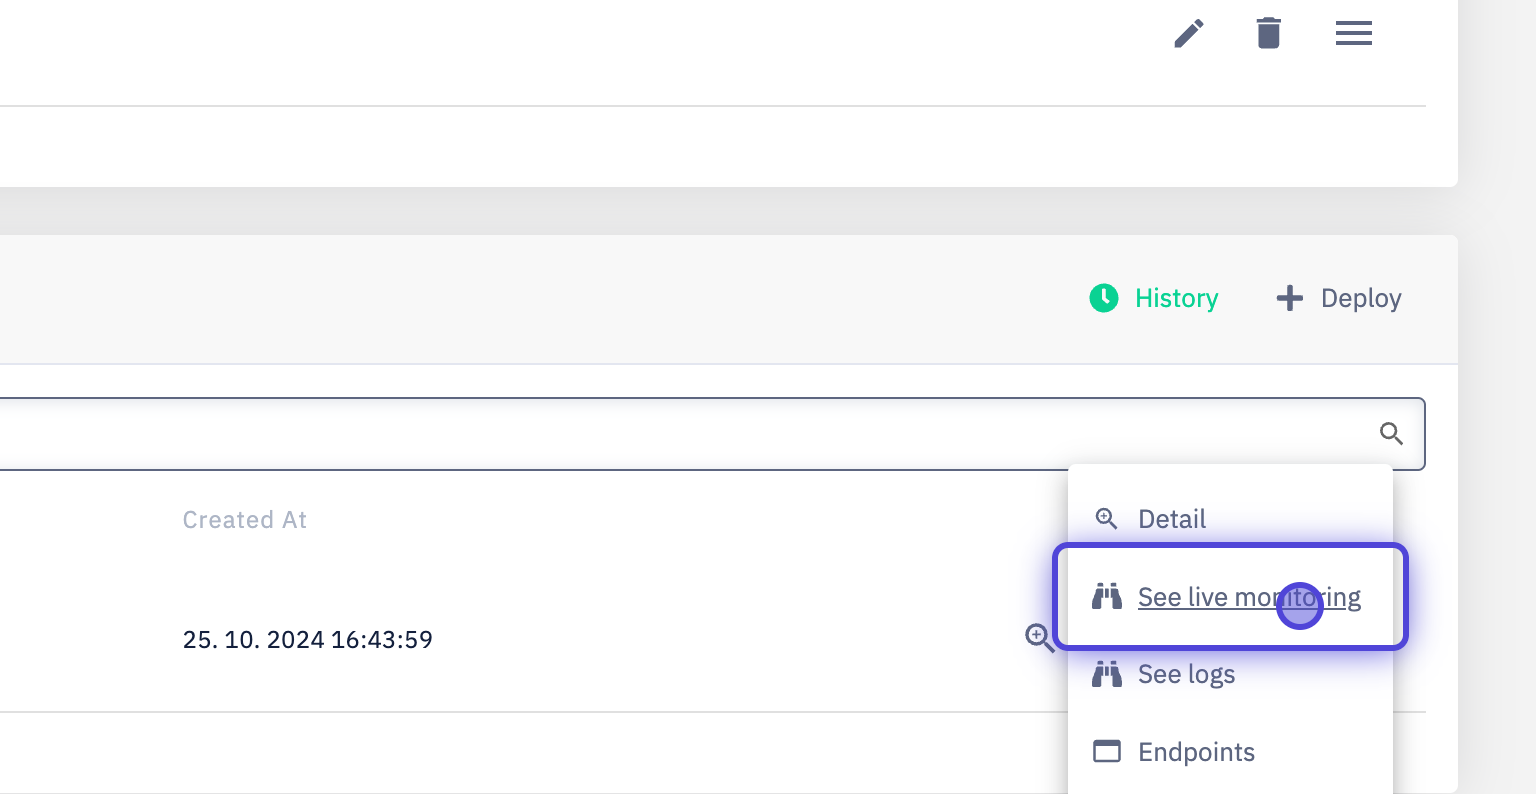
If you want to see the live monitoring of your application, simply go to "Applications" and choose the "My Applications" option.
- There, choose the application, see the "Deployed Applications" section and click on detail and then the "See live monitoring" button and you will be redirected to the Grafana UI page.

CPU Usage
-
It is important to monitor the CPU usage, because you can control the flow of your application/environment.
-
If the CPU is overused, it can throttle processes and affect performance.
-
The graph shows you the CPU usage in real-time.
- If CPU usage spikes upward, the user interface of that server will eventually slow down, and multiple processes will crash along with the application running on that server.
- High CPU usage can also cause high memory utilization issues that can cause a server to go down.

CPU Quota
- This table represents the general information on CPU usage in a particular pod.

Memory Usage
-
Monitoring memory usage is essential in guaranteeing maximum performance.
-
High rates of memory utilization results in decreased performance for the related processes.
-
The graph shows you the CPU usage in real-time.
- A steady increase in memory utilization over time may indicate a memory leak. A memory leak is when memory is allocated by processes as they start, but is not released when they end.
- Memory leaks degrade application performance over time. Typically, it may become unresponsive when memory is no longer available.

Memory Quota
- This table represents the general information on memory usage in a particular pod.

Current Network Usage
- Here you can see some of the main information on network usage, gathered in one table.
- These details are shown for every pod of your environment.
- You need to monitor these values, so your application performance won't be affected by any unexpected processes.
- And if the productivity of your application was slowed down by any of the unwanted events, you are able to quickly analyze and fix these issues.
- The detailed live monitoring on a single value is presented below.

Receive Bandwidth
- Receive bandwidth indicates how much of the receiving throughput capability is consumed by the node.
- If your node consumes too much received bandwidth, it might indicate the "bottleneck problem".
- That means your application requests will take longer than was expected.
- It might end up with failed requests.
- If your node consumes too much received bandwidth, it might indicate the "bottleneck problem".

Transmit Bandwidth
- Transmit bandwidth indicates how much of the transmitting throughput capability is consumed by the node.
- If your node consumes too much transmit bandwidth, it also might indicate the "bottleneck problem".
- Your application might fail to send the information using the network.

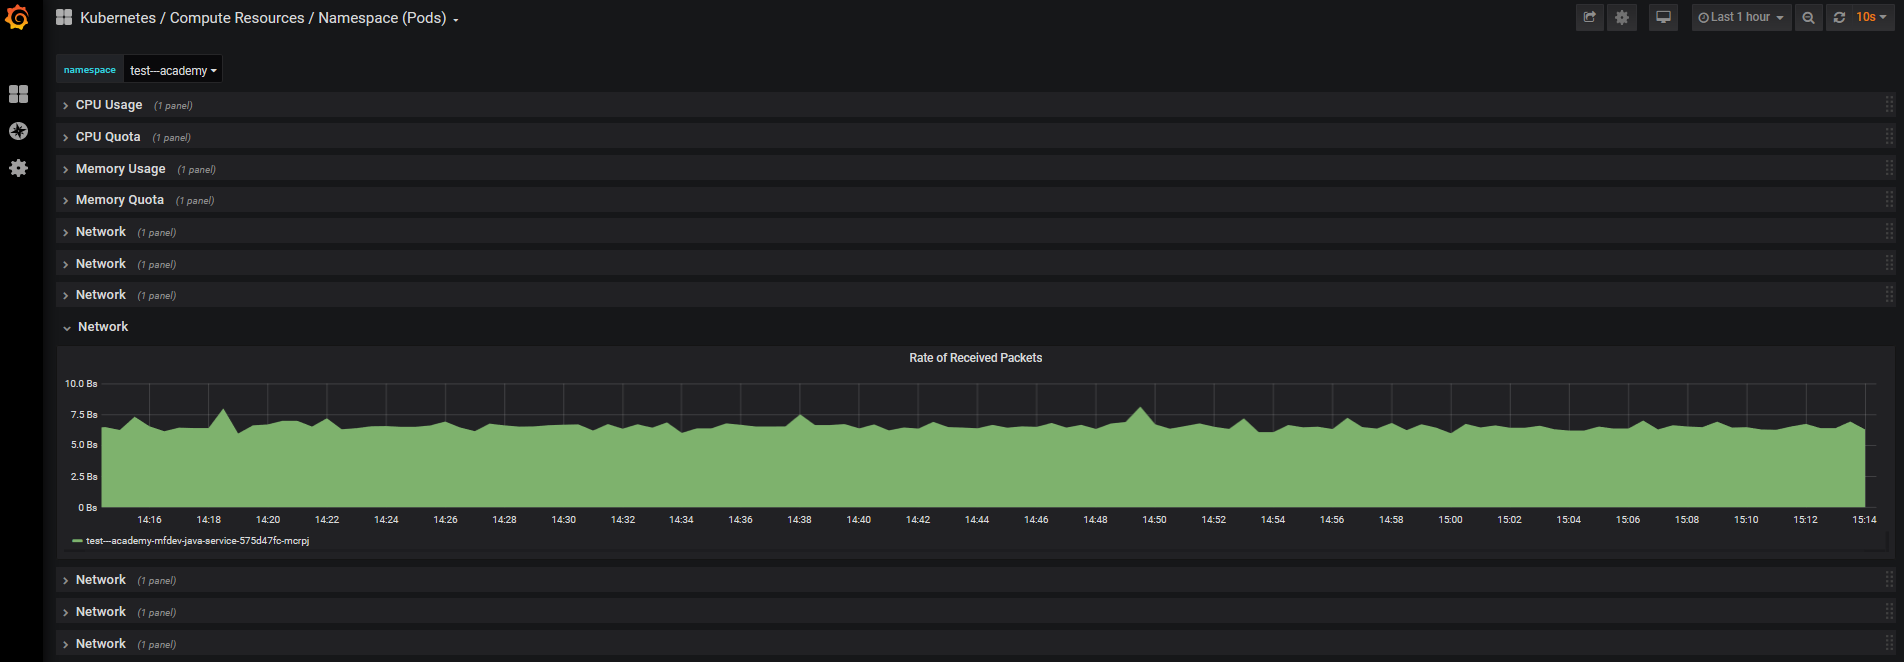
Rate of Received Packets
- This section shows the number of successfully received packets in a real-time graph.

Rate of Transmitted Packets
- This section shows the number of successfully sent packets in a real-time graph.

Rate of Received Packets Dropped
- This section shows the number of lost packets that were supposed to be received in a real-time graph.

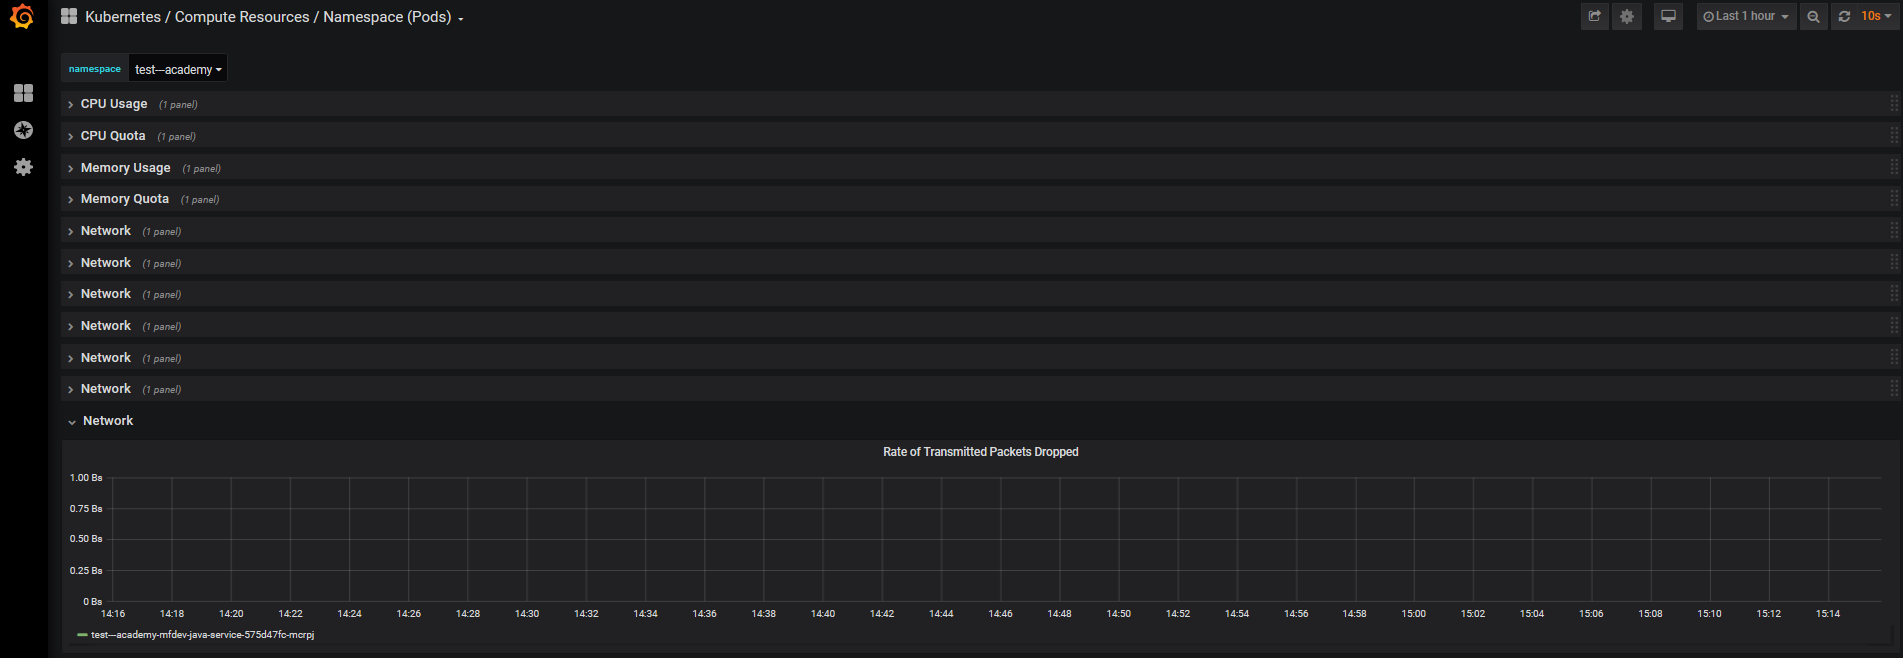
Rate of Transmitted Packets Dropped
- This section shows the number of lost packets that were supposed to be sent in a real-time graph.

Learn more about Grafana