Service Mesh - Graph
🕓 10 minutes
What you’ll learn
- How to find dependencies between your applications and their components inside the specific environment.
- How to investigate the component statistics such as traffic, inbound/outbound metrics for the node or edge, and many more.
Prerequisites
Steps
The basics
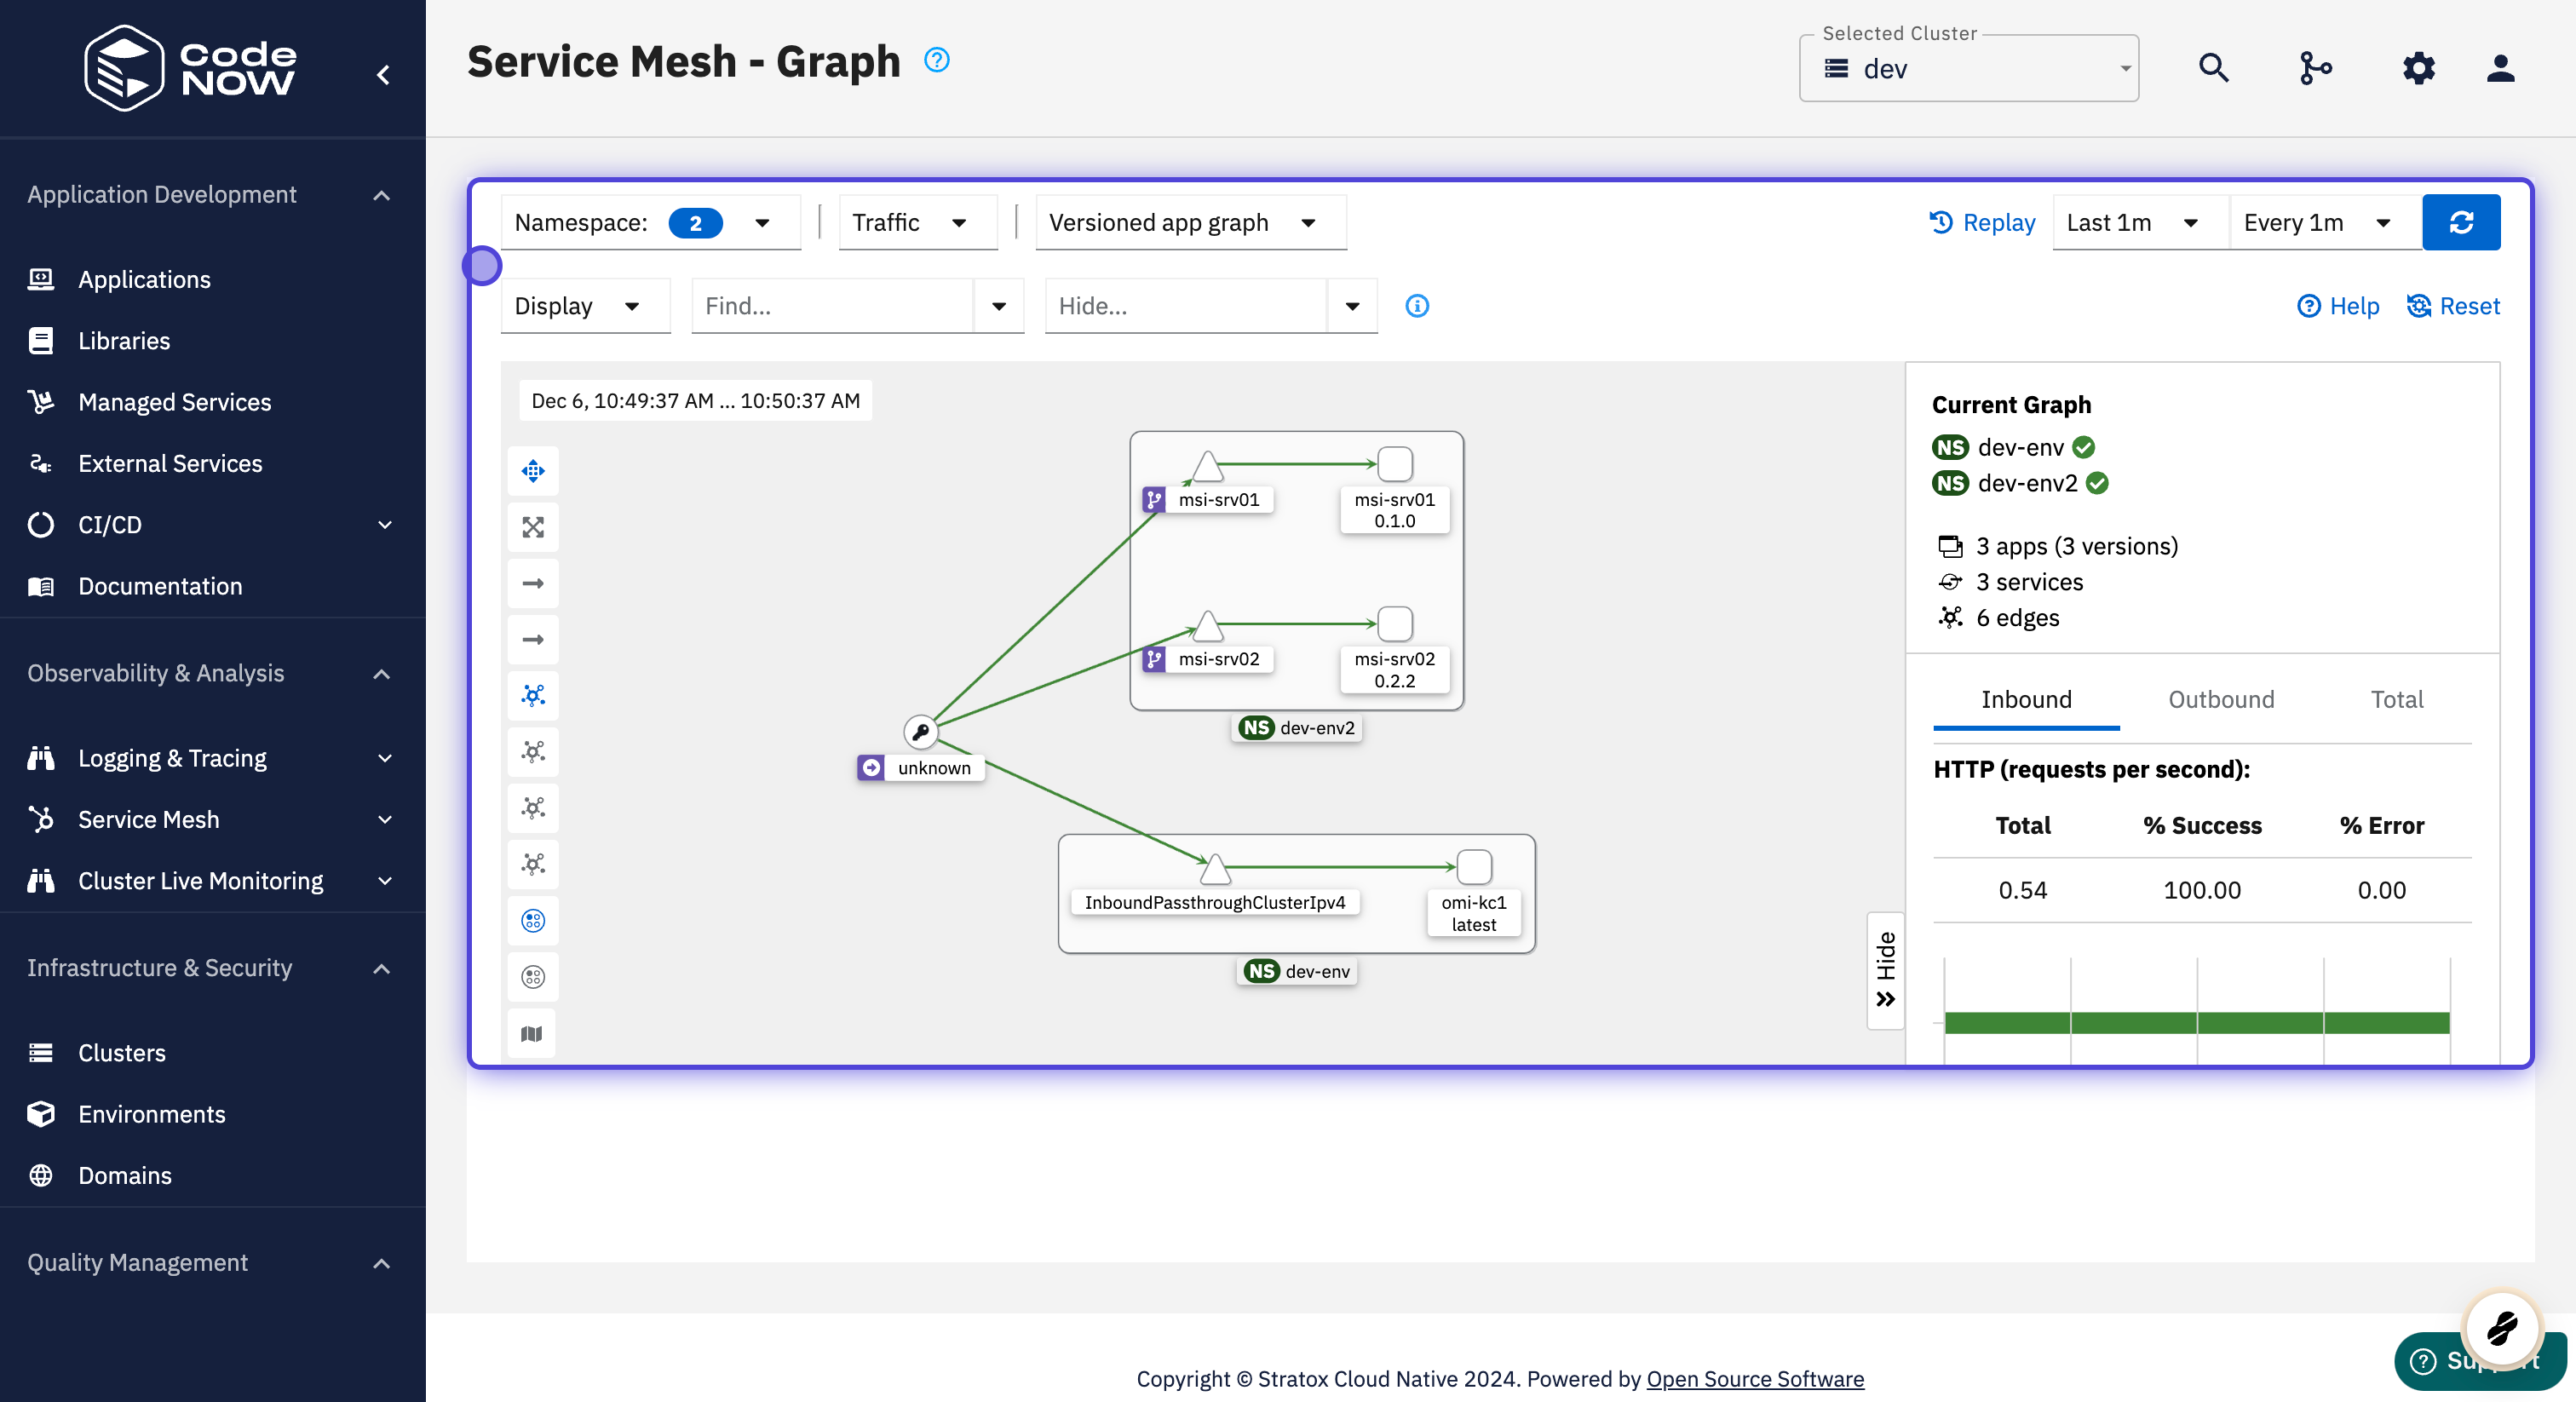
- Find the "Service Mesh" section in the sidebar menu and choose the "Graph" option.
- There you can see a graph that represents the application components that are contained in your environment. The graph also shows how these components are related to each other.
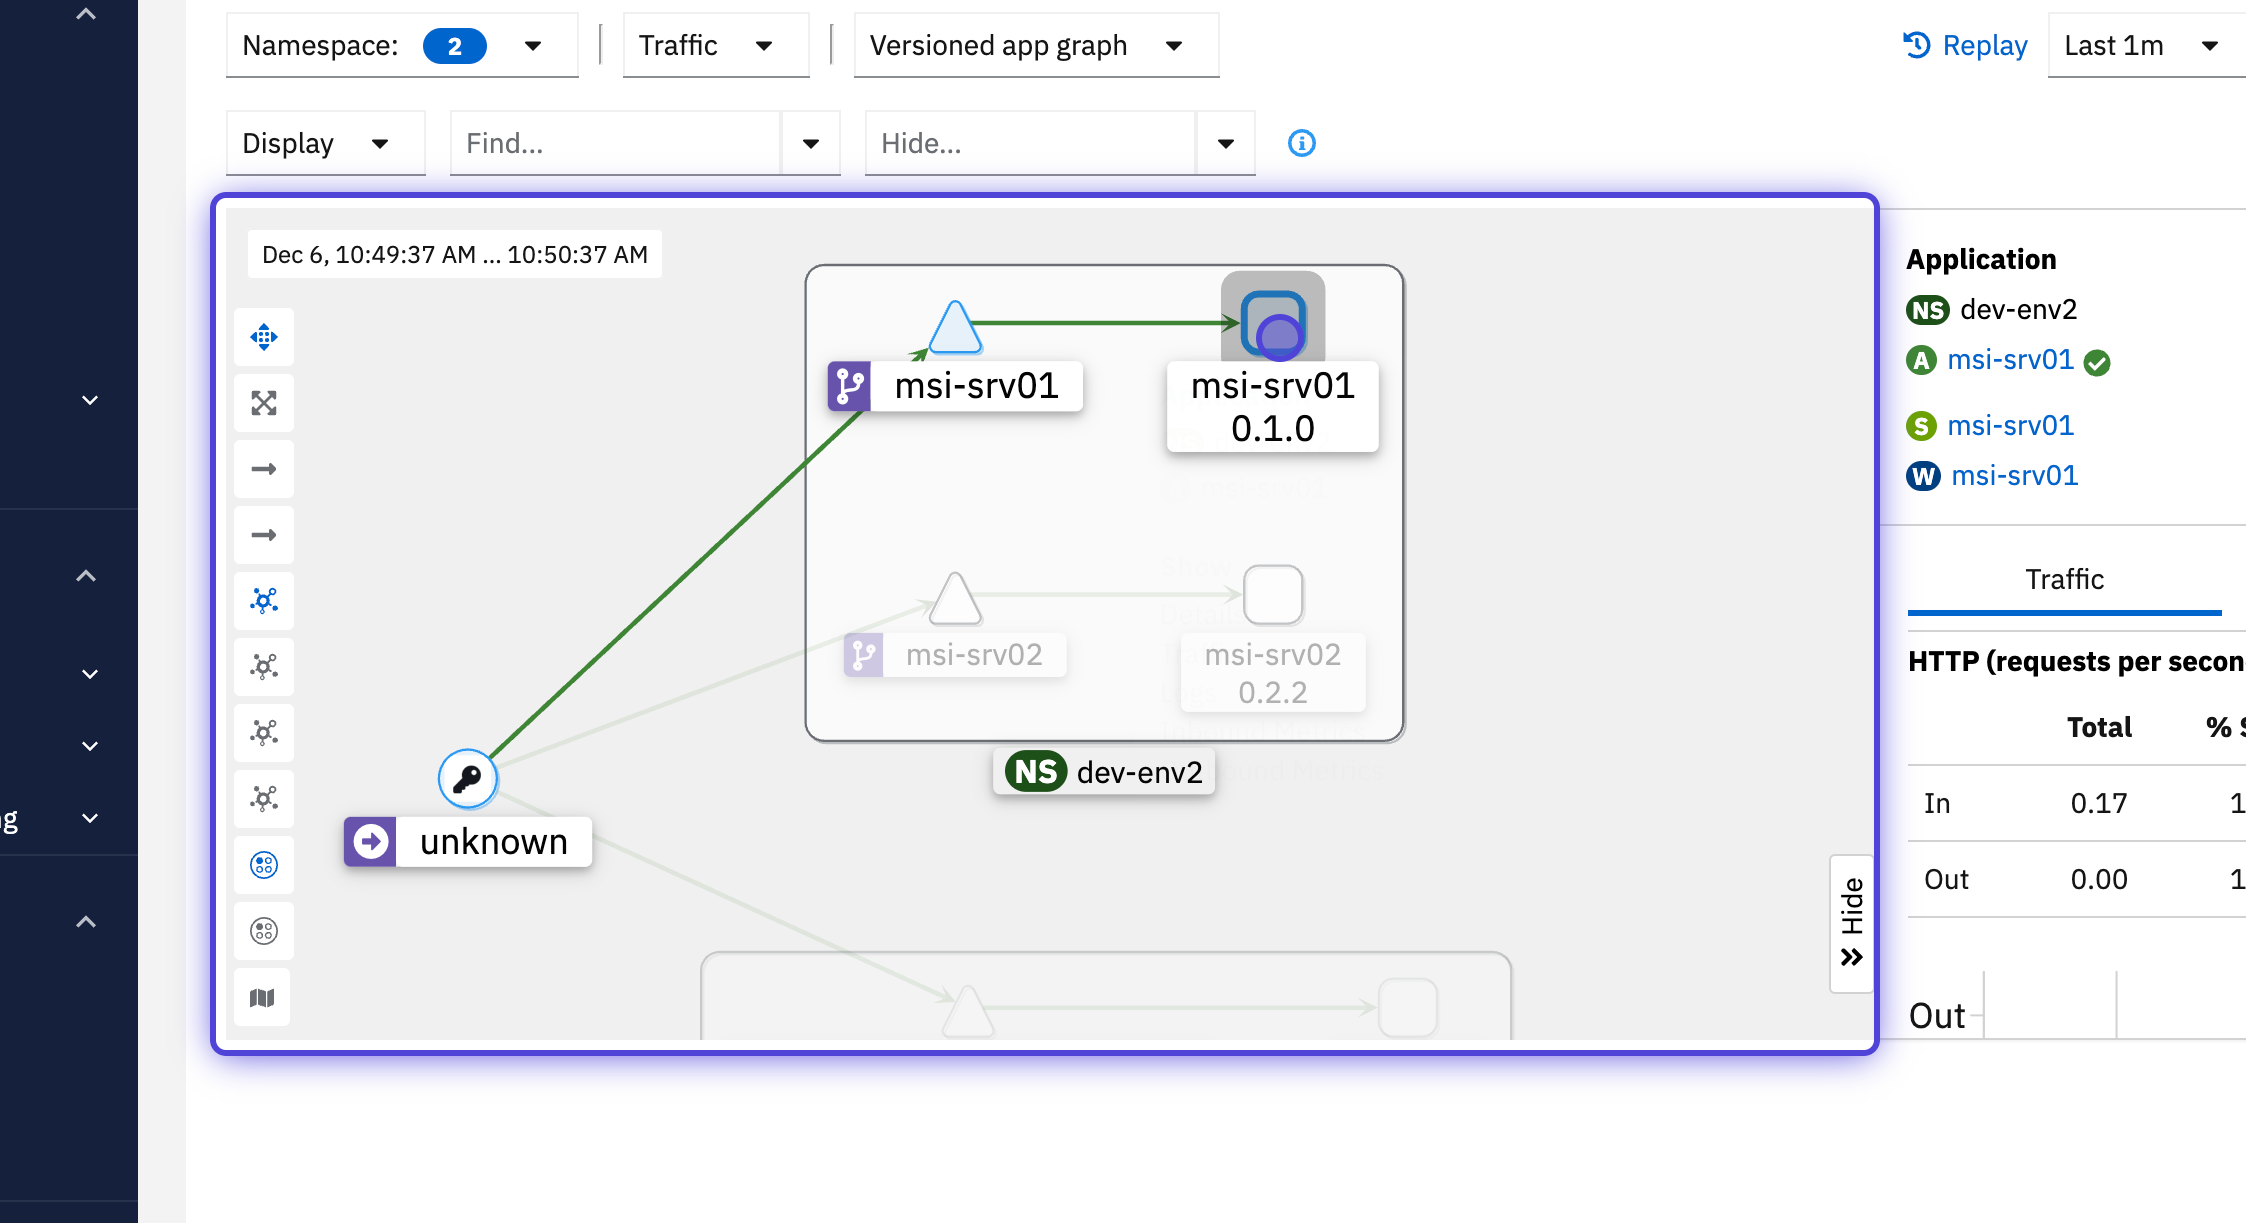
- Click on a node to see its summary and emphasize its end-to-end paths.
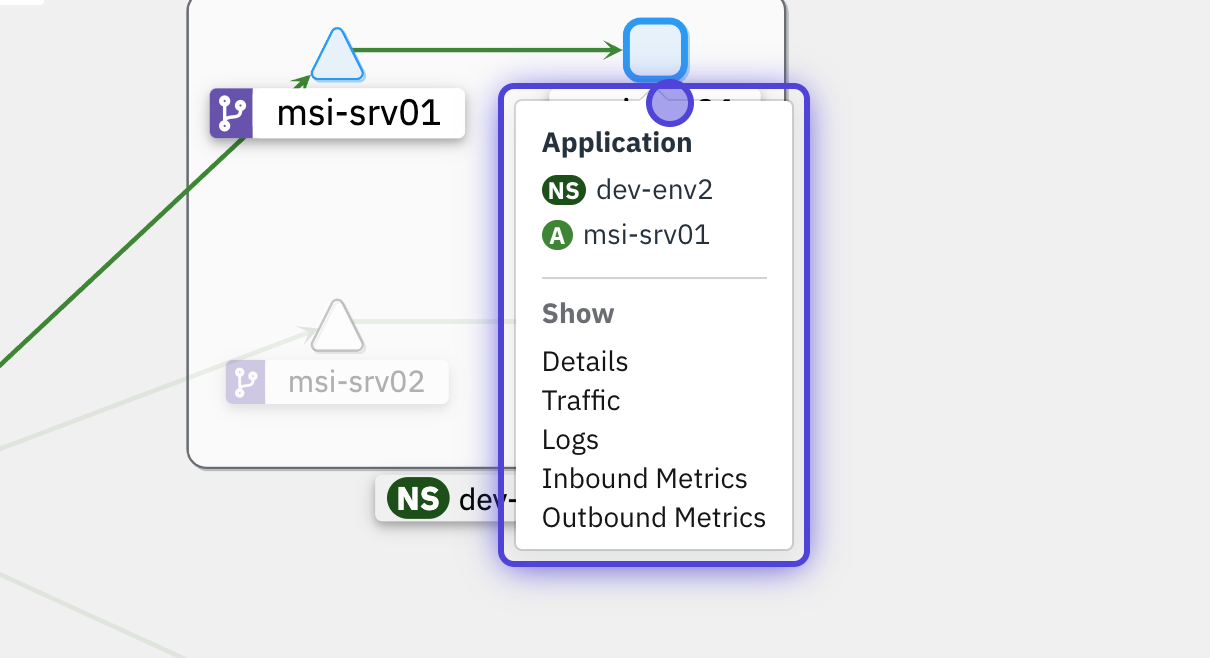
- Right-click a node or an edge to see the contextual menu with links to the details, traffic and inbound/outbound metrics for the node or edge.
Additional options
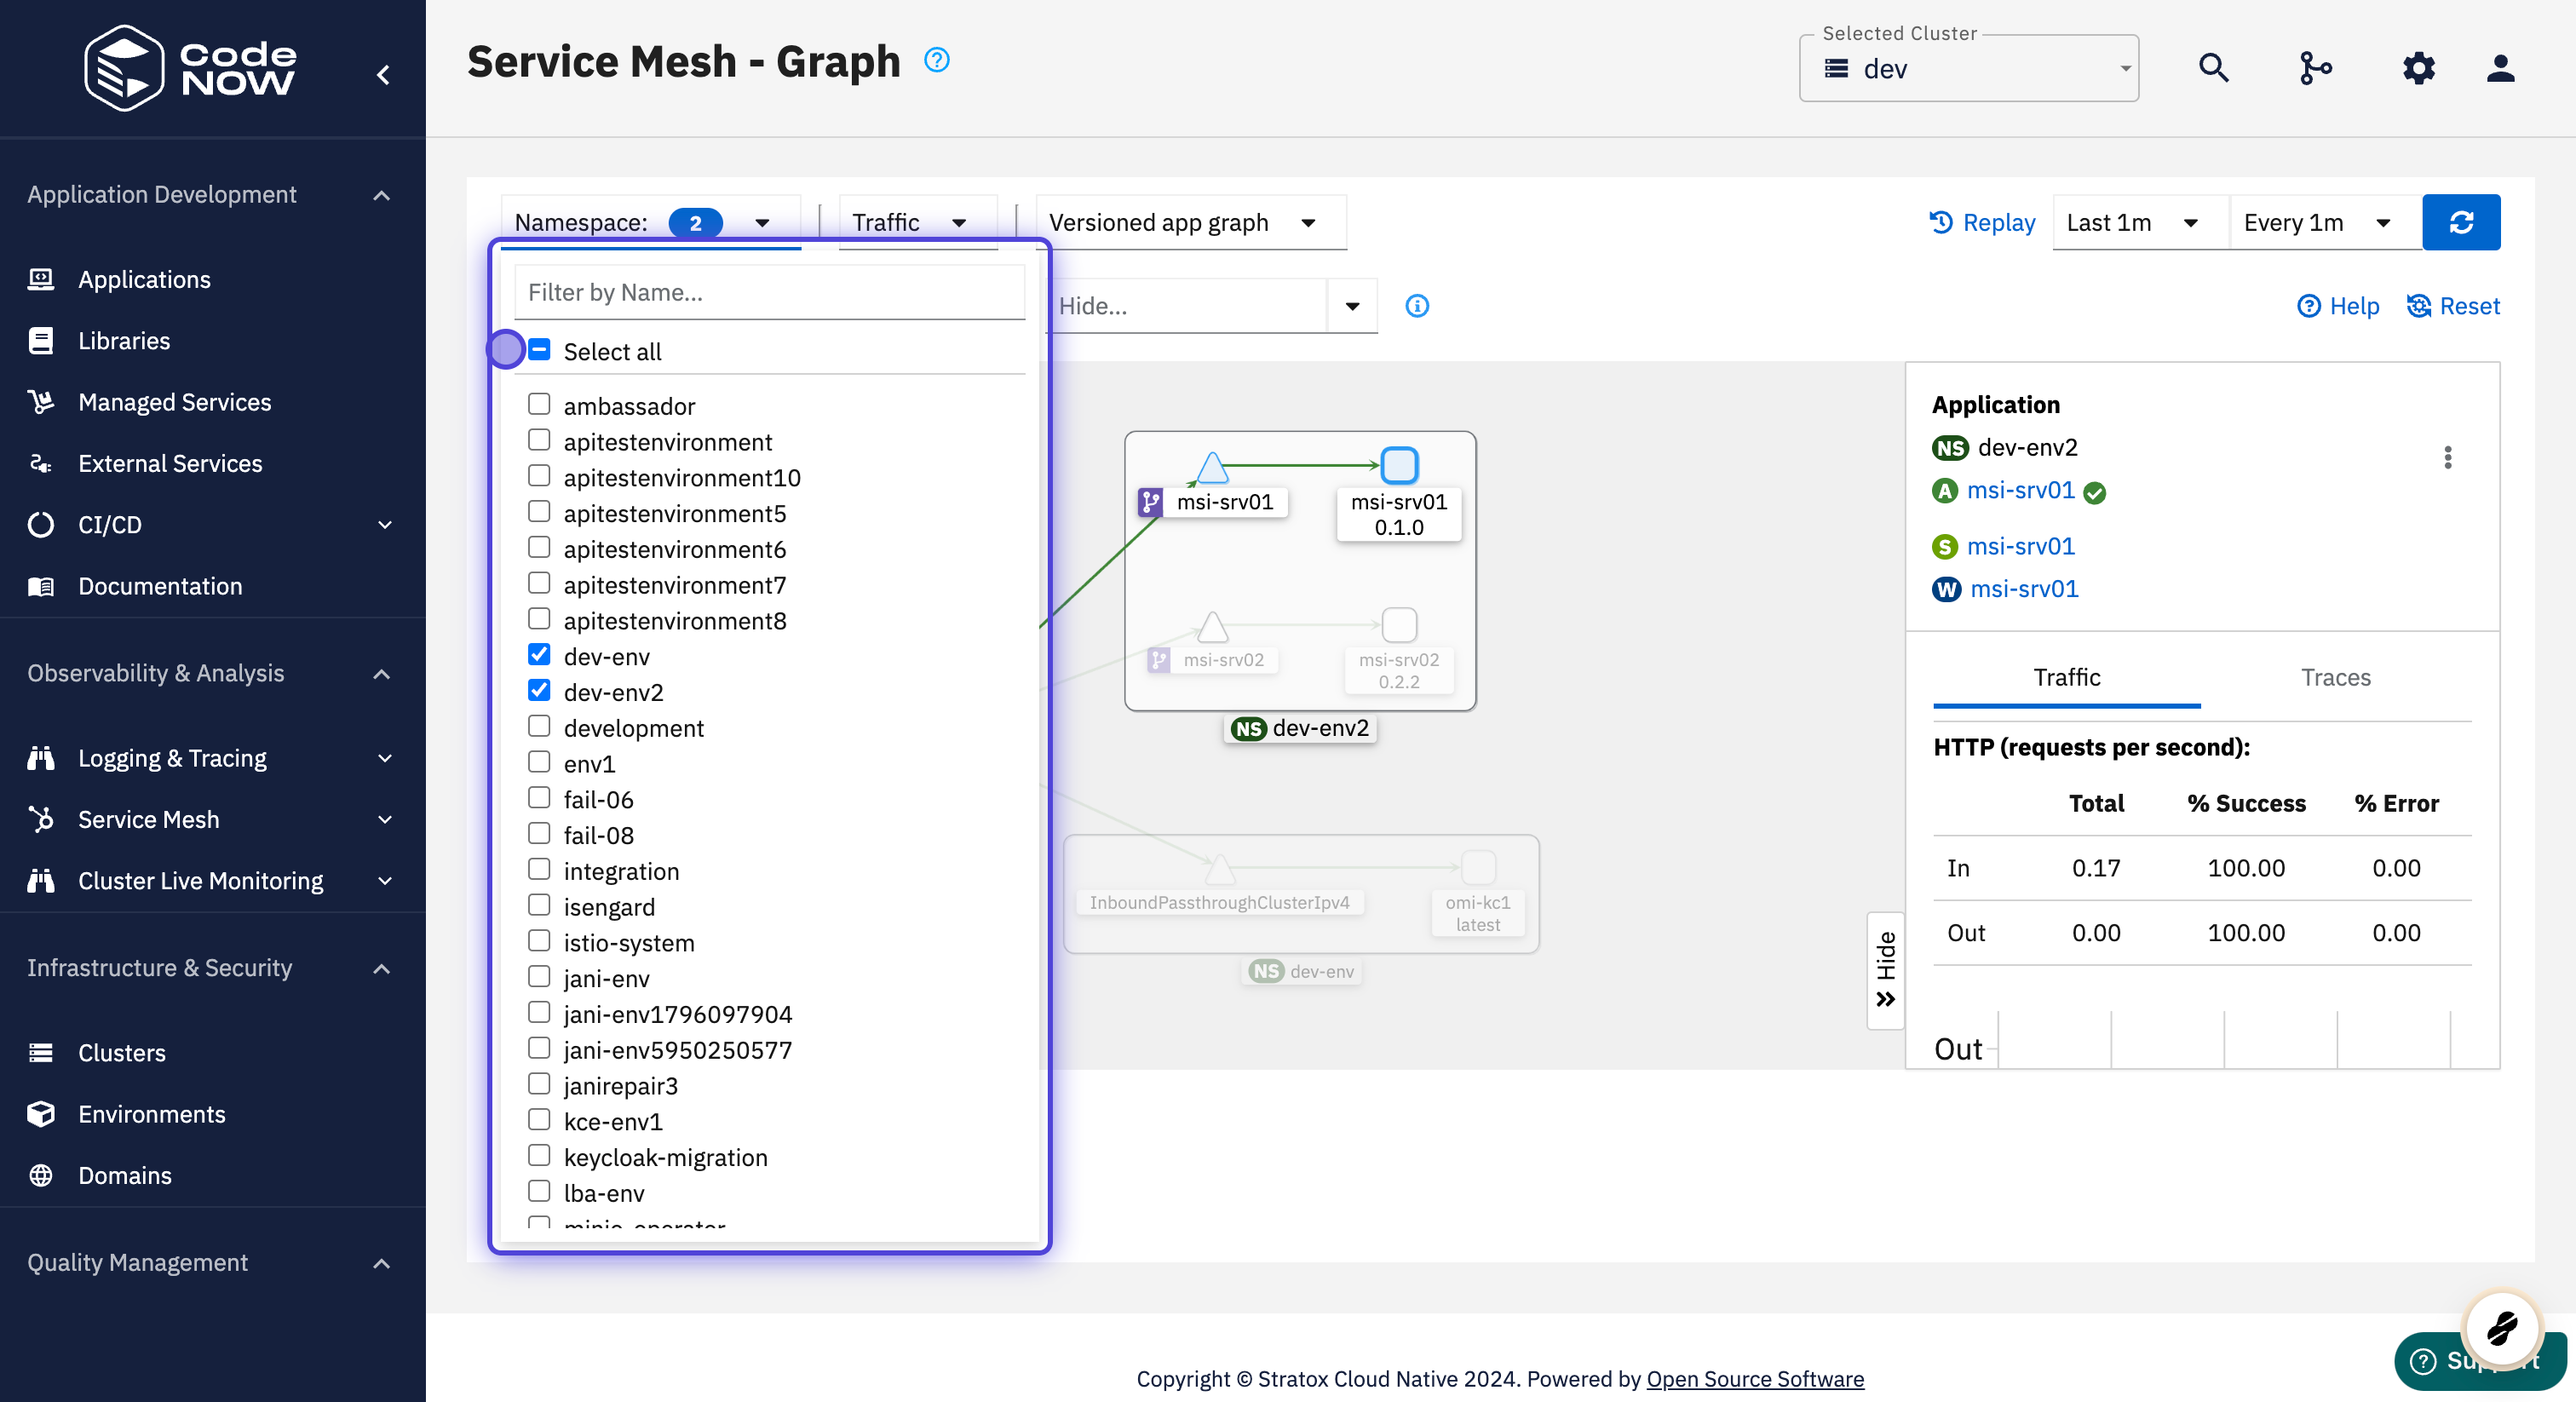
- If you want to select a different environment, you can select its name in the upper bar menu.
- You can also select a graph type and how you wish to display the statistics.
- You can select a workload, service or application graph view.
- An application view can optionally be versioned and relies on the app and version labeling.
- Workload graphs provide physical views.
- Service graphs provide logical views.
- You can select a workload, service or application graph view.
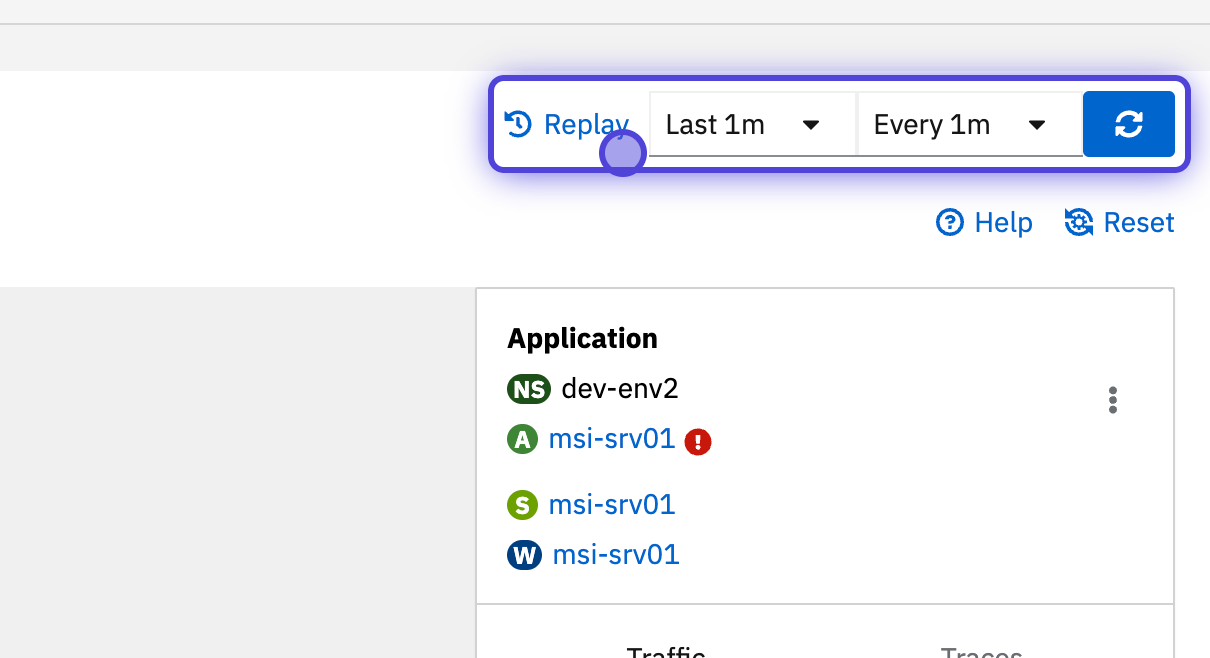
- You can select how often to refresh the graph and how much historical metric data is used to build the graph per refresh.
- The display option is used for setting the edge labeling, node badging, and various display options.
- Highlight or Hide graph elements via typed expressions.
- Click the Find/Hide help icon for details.
- There is also a possibility to select the graph layout for the mesh.
- Different layouts work best with different meshes.
- Other buttons here provide zoom and fit-to-screen options.
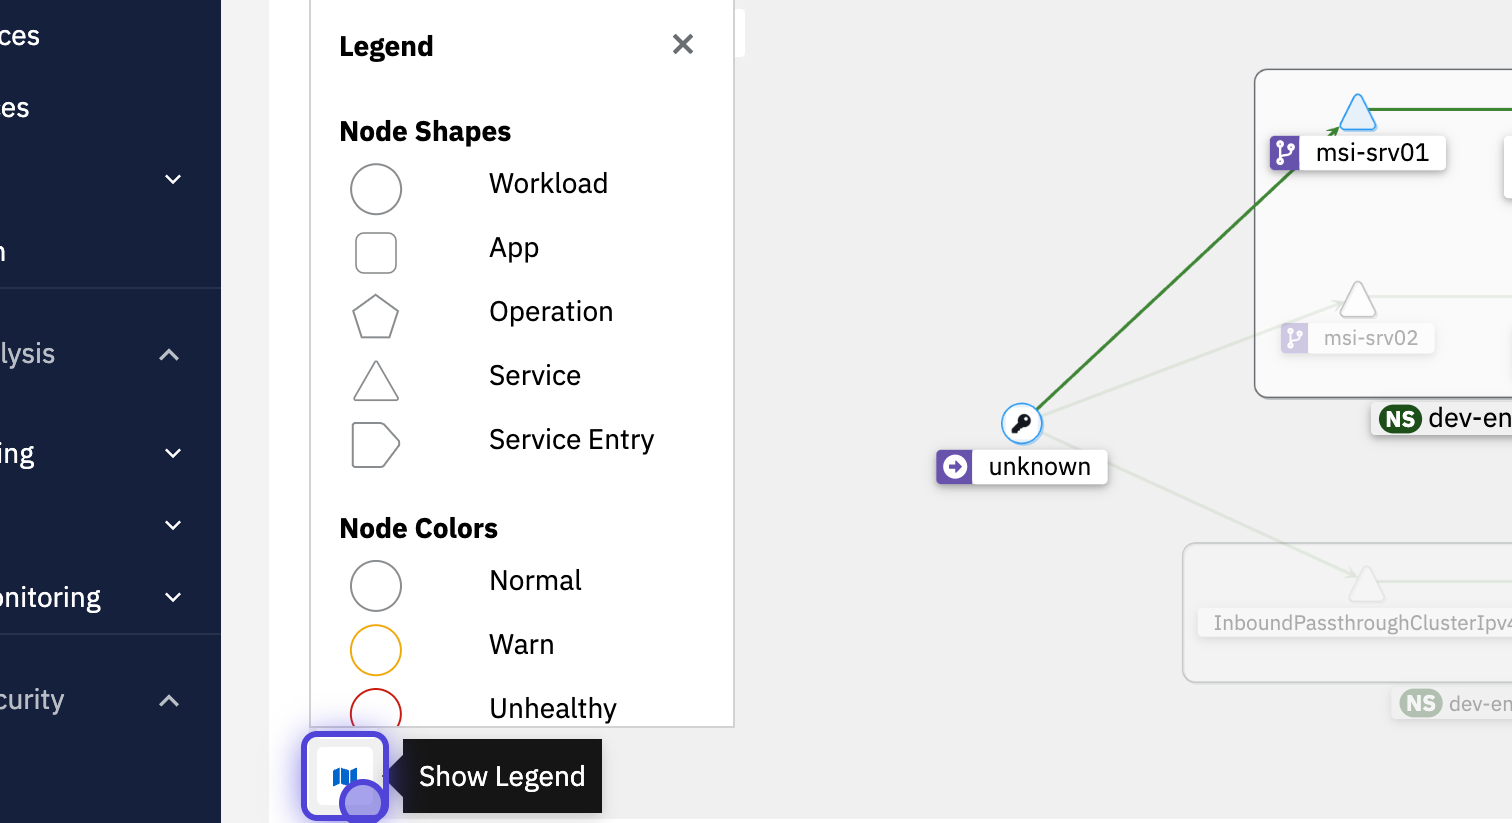
- If you are struggling to understand the forms that are used for the graph building, you can click on the "Legend" button below.
- There, you can find the definitions of every graph component.
info
You can find out more by clicking on the "Graph tour" button in the upper right corner in the Service Mesh - Graph section on the CodeNOW.
info
If you are interested in a tool that was used to create the service mesh, see: https://kiali.io/docs/.
