Service Mesh - Overview
🕓 10 minutes
What you’ll learn
How you can see all your environments with detailed statistics of the contained applications and related components.
- Dependencies between your applications and their components, represented as a graph.
- Overview of all your current workspaces with their details.
- Components that are inside the chosen workspace with its labels, health and configuration status.
- Virtual services that are running inside the chosen workspace with their type, and configuration status.
Prerequisites
Outline
Find the "Service Mesh" section in the sidebar menu and choose the "Overview" option.
-
There you can see all your available environments.
- You can filter workspaces by Namespace, Health, mTLS status or Namespace Label.
- You can also sort them by Name, Health, mTLS or Istio config.
-
For each workspace you can see these detailed analyses:
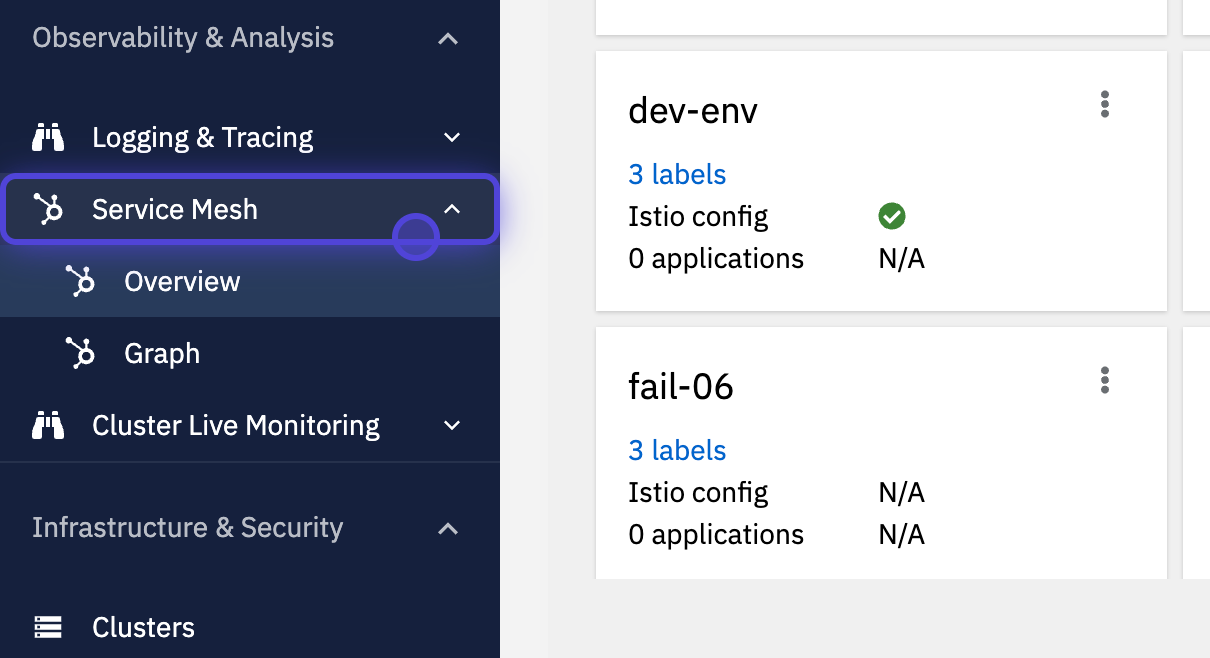
Navigate to service mesh overview
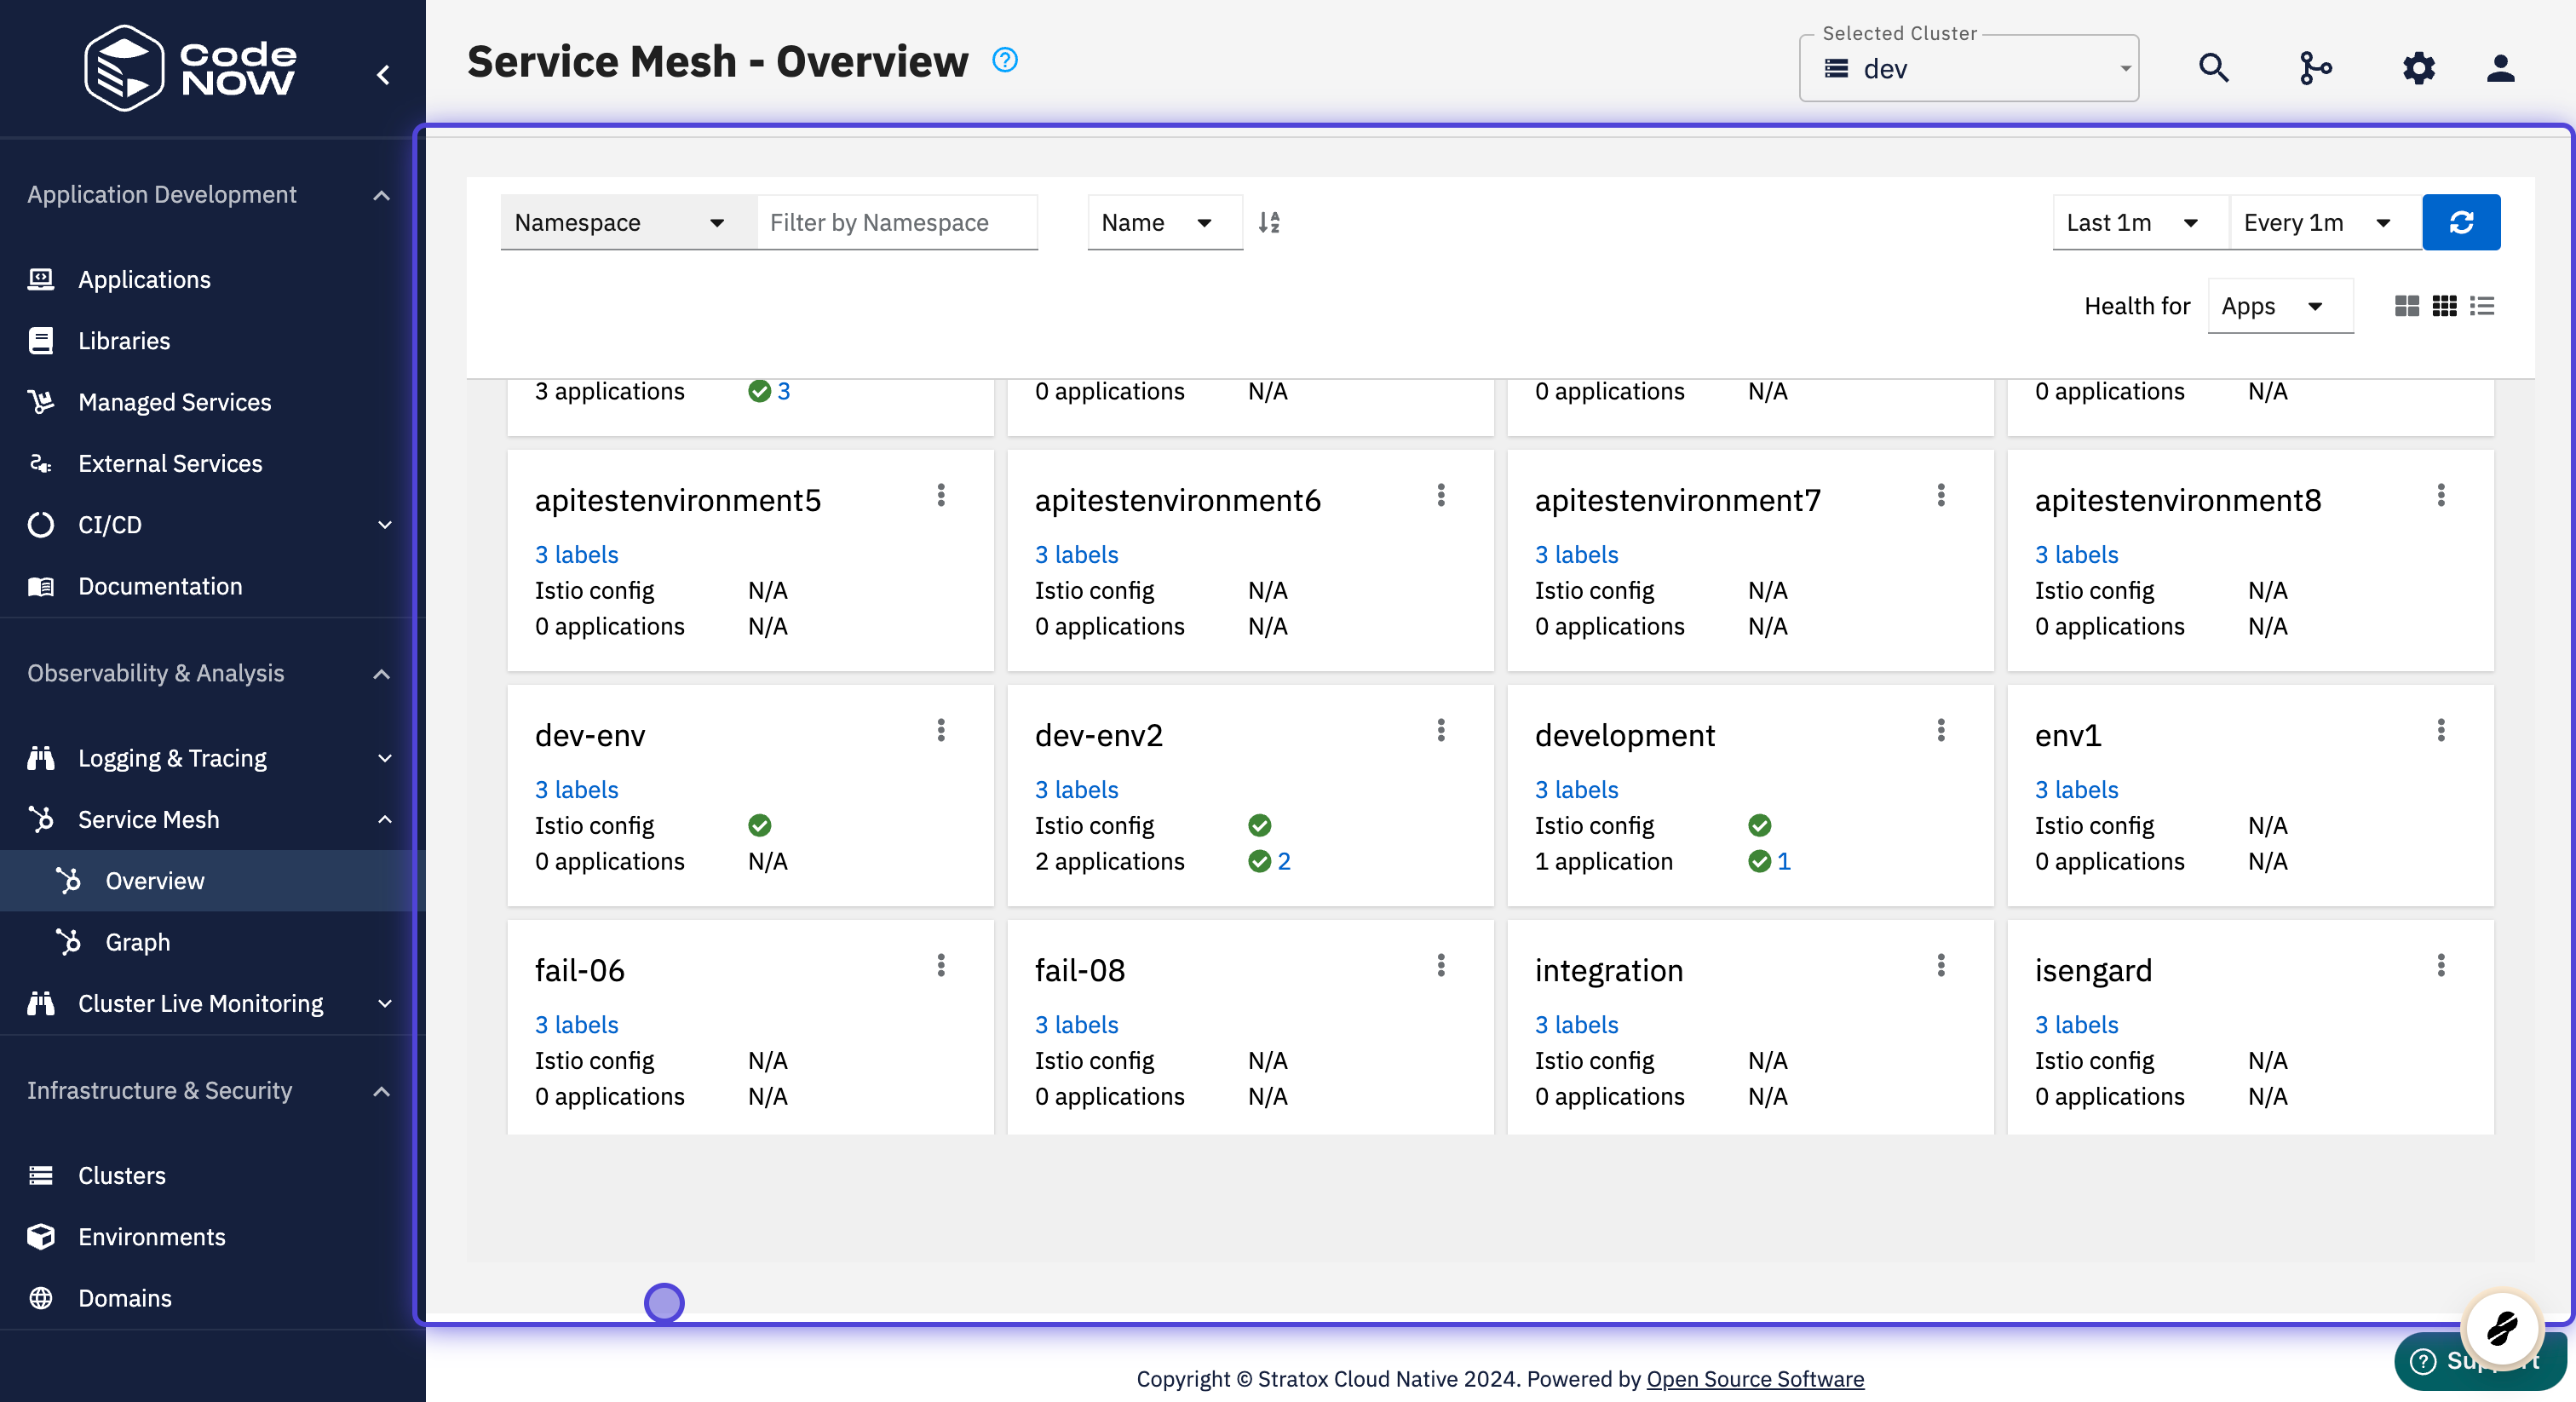
Possible filters
1 / 2
Show Graph
- There you can see a graph that represents the application components that are contained in your environment. The graph also shows how these components are related to one another.
- For more information about the graph analysis, see the Service Mesh - Graph document.
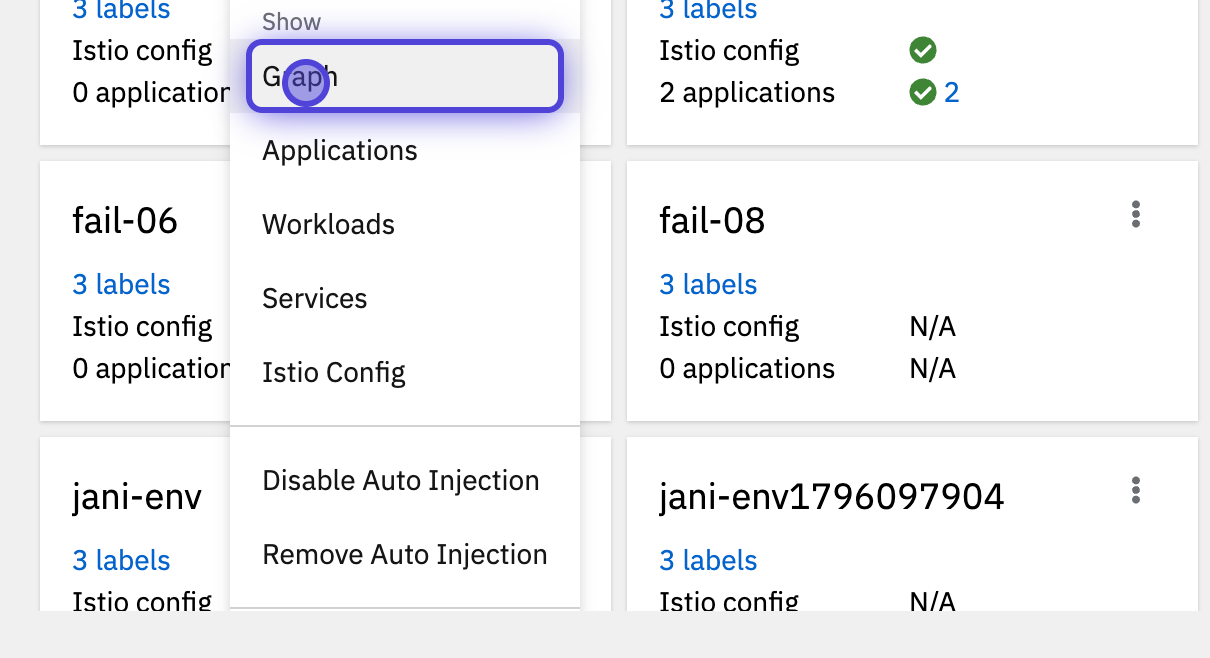
Show graph
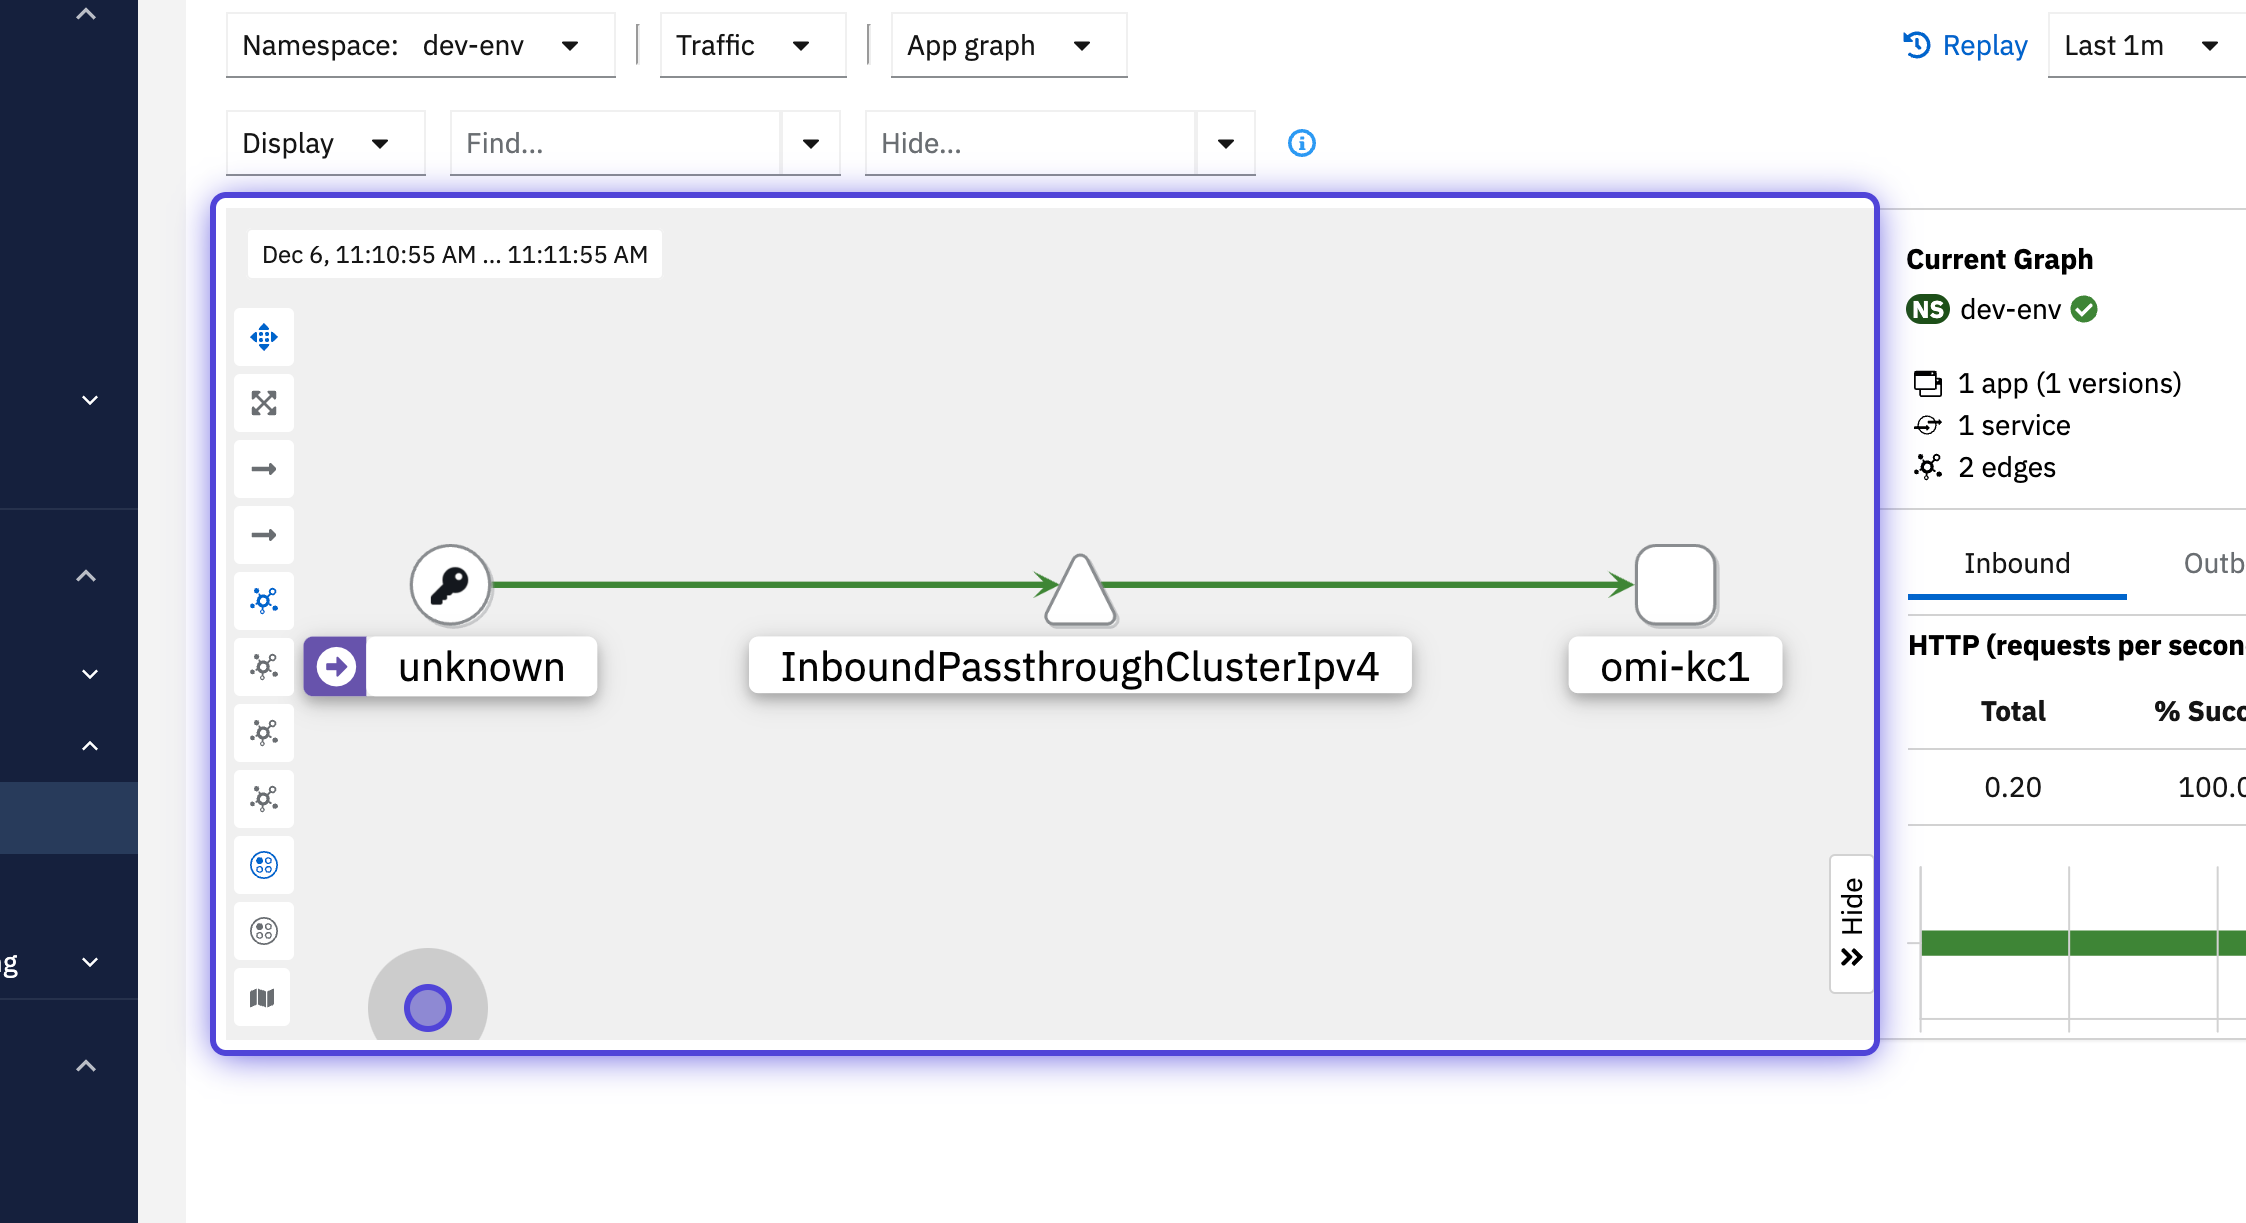
View the Service Mesh Graph for your environment
1 / 2
ß
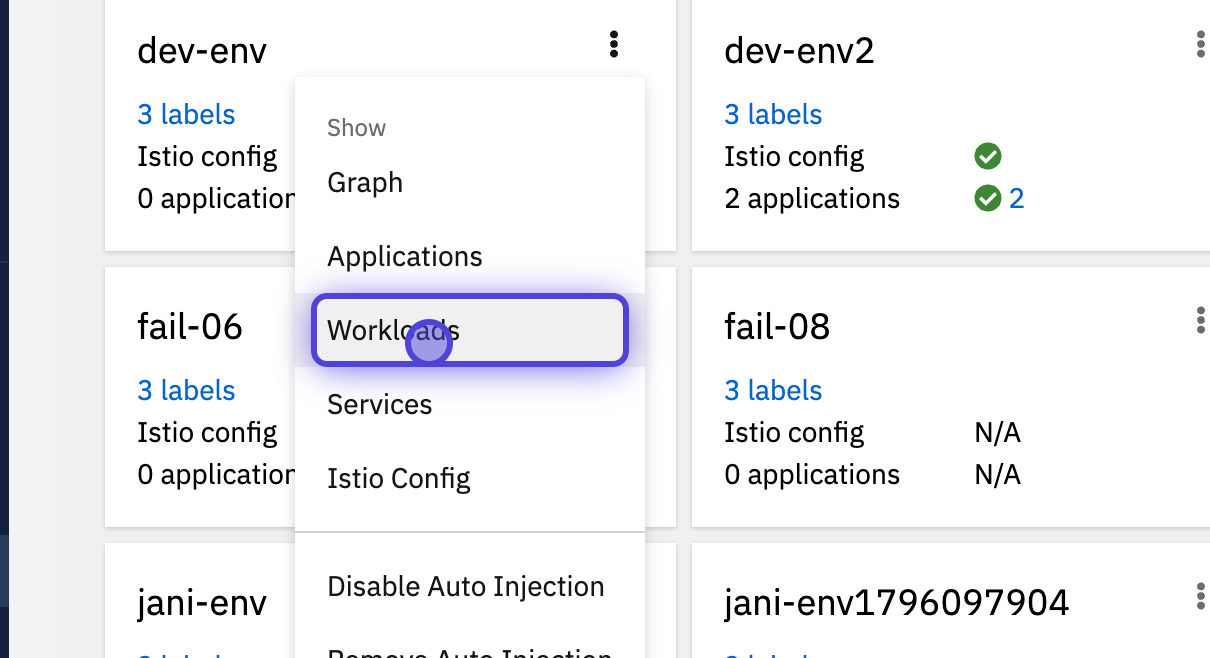
Show Workloads
- After you have clicked on the "Show workloads" button, you will see your current workspaces with their details.
- If you want to know more about the workloads in Kubernetes, see: https://kubernetes.io/docs/concepts/workloads/
- You can click on a workspace's name and see the statistics related to the chosen workspace such as the overview, traffic, logs, inbound and outbound metrics.
Show services

Select a workload
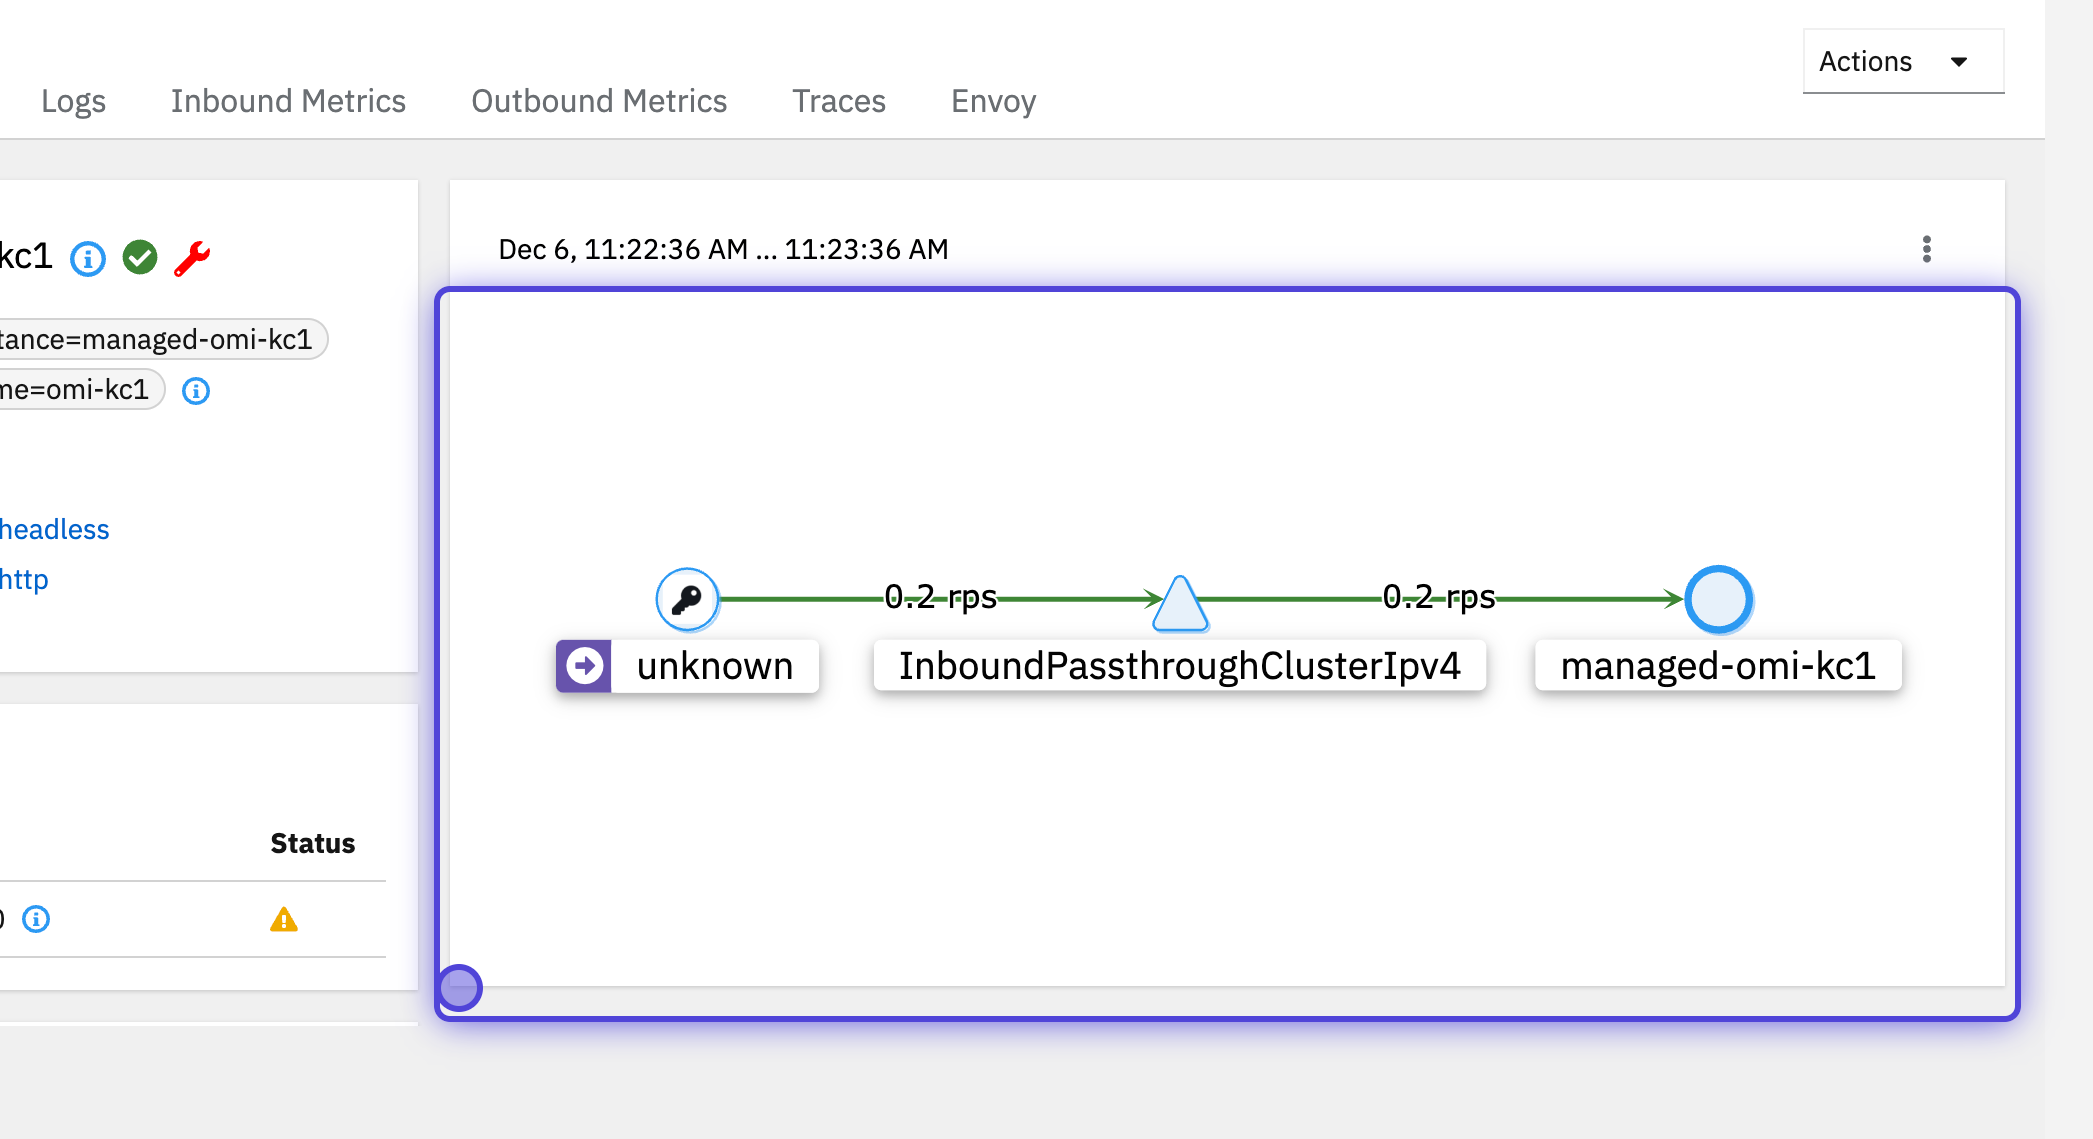
View the selected workload
1 / 3
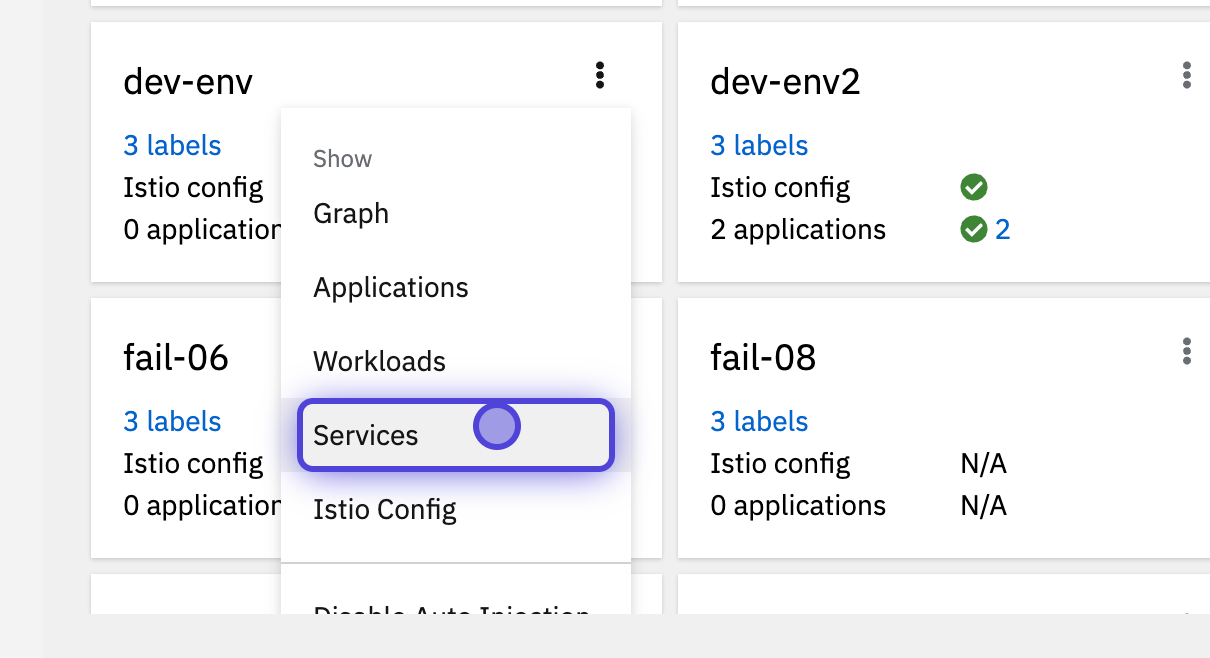
Show Services
- After you have clicked on the "Show services" button, you will see all the components that are inside the chosen workspace with its labels, health and configuration status.
- You can click on a component's name and see the statistics related to the chosen component such as traffic, inbound metrics and traces.
Show services
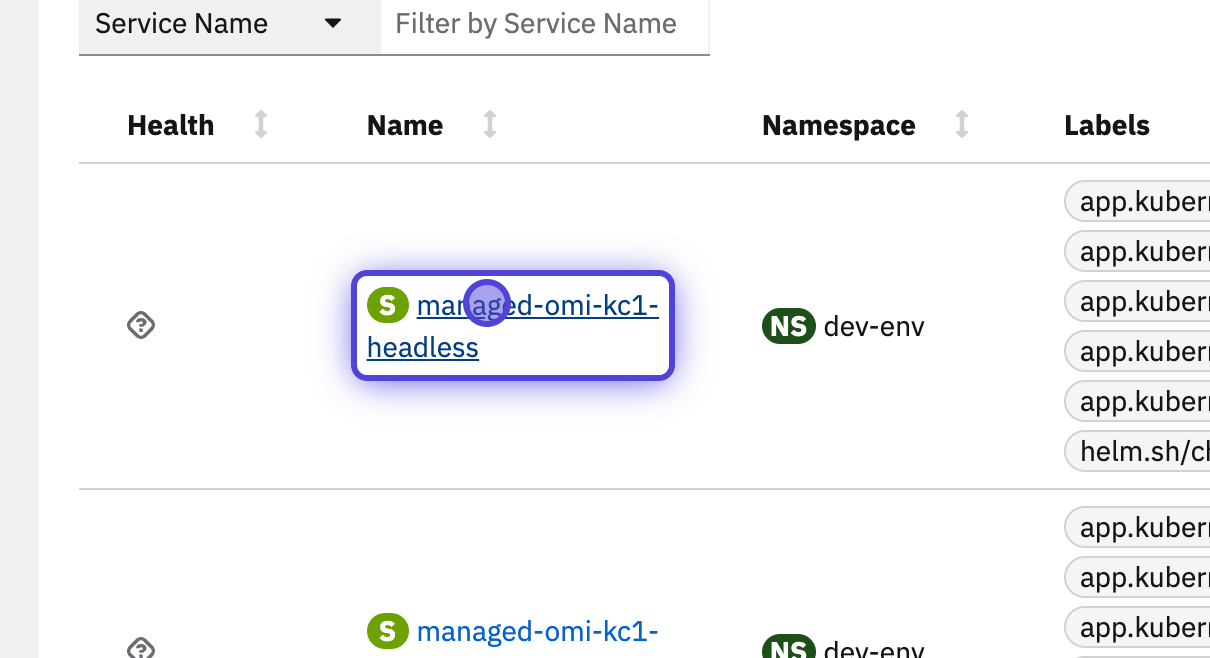
Select a service
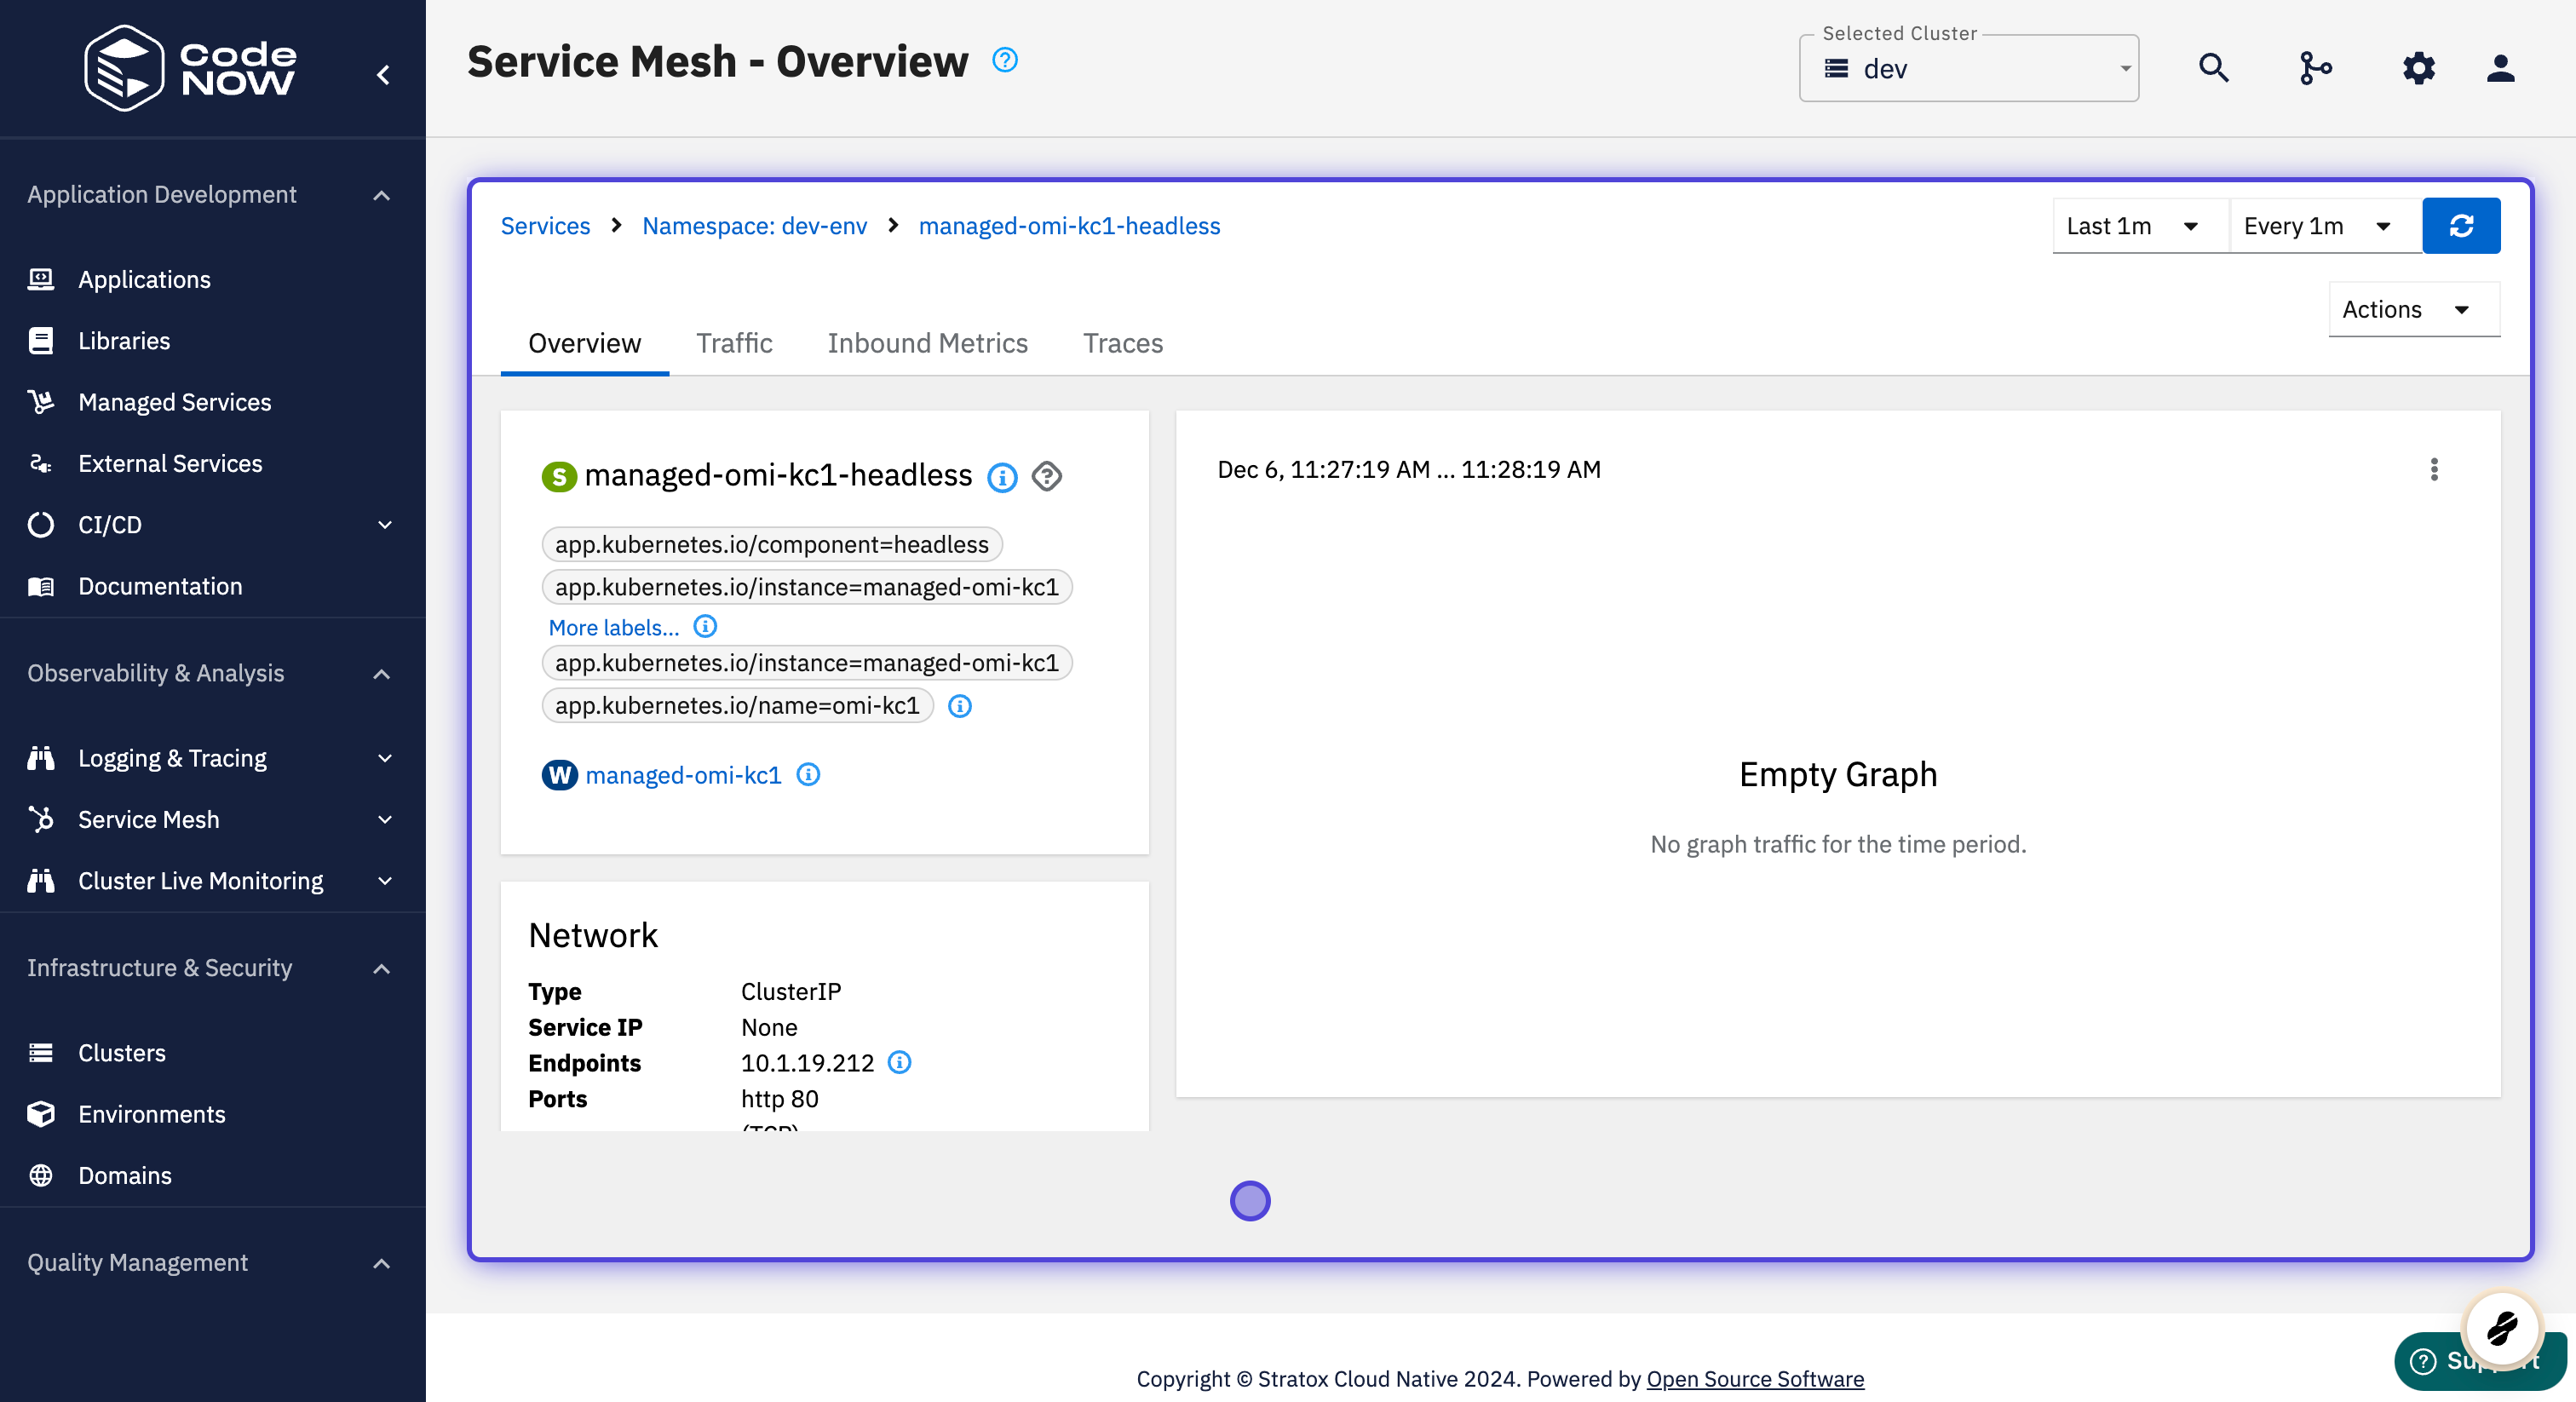
View the selected service
1 / 3
Show Istio Config
- After you have clicked on the "Show Istio config" button, you will see all the virtual services that are running inside the chosen workspace with its type and configuration status.
- If you want to know more about Istio configuration in Kubernetes, see: https://istio.io/latest/docs/concepts/what-is-istio/
- You can click on its name to see a detailed overview and the YAML configuration file of the chosen virtual service.
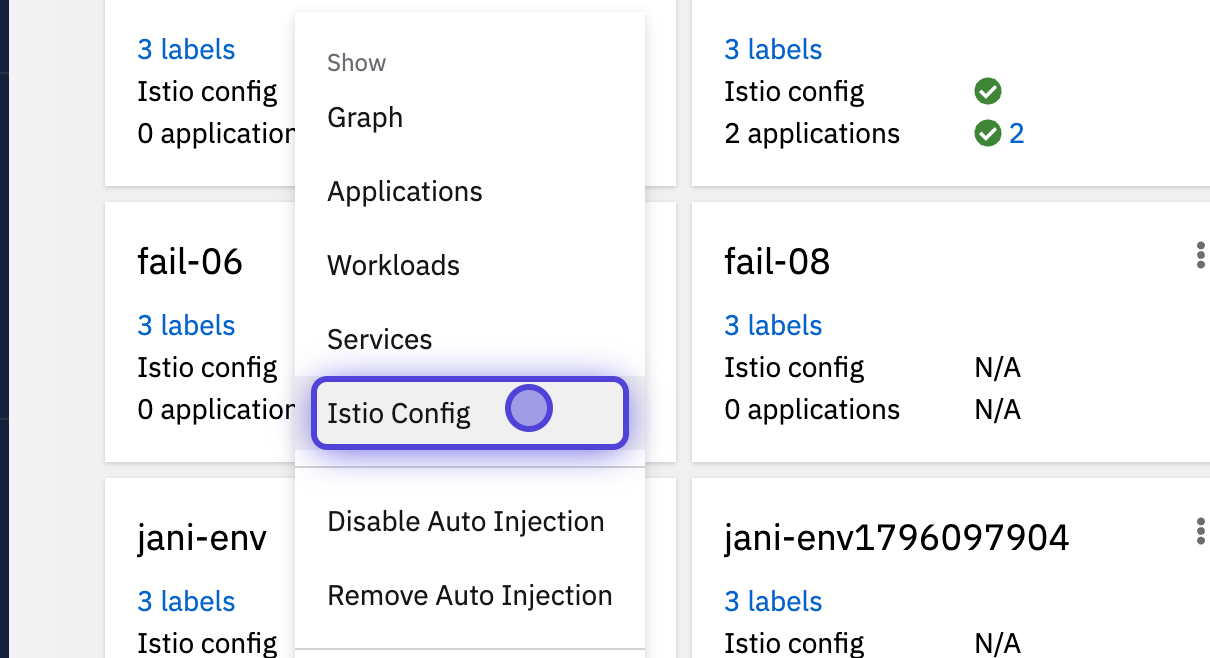
Show istio config
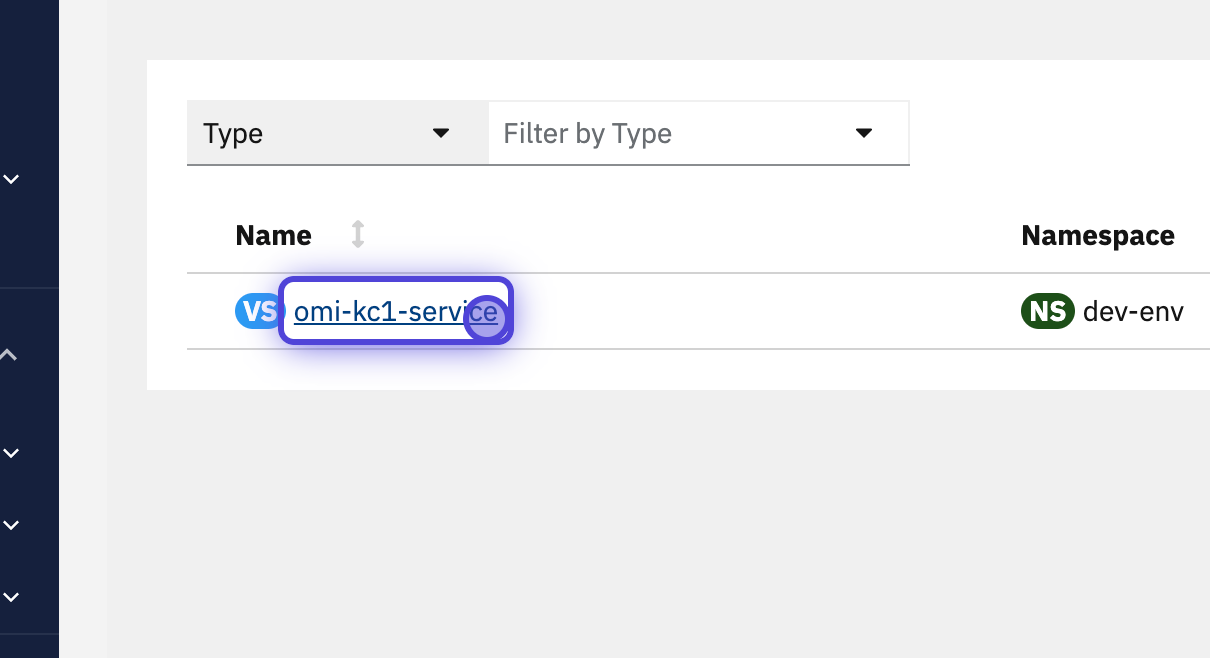
Select a virtual service
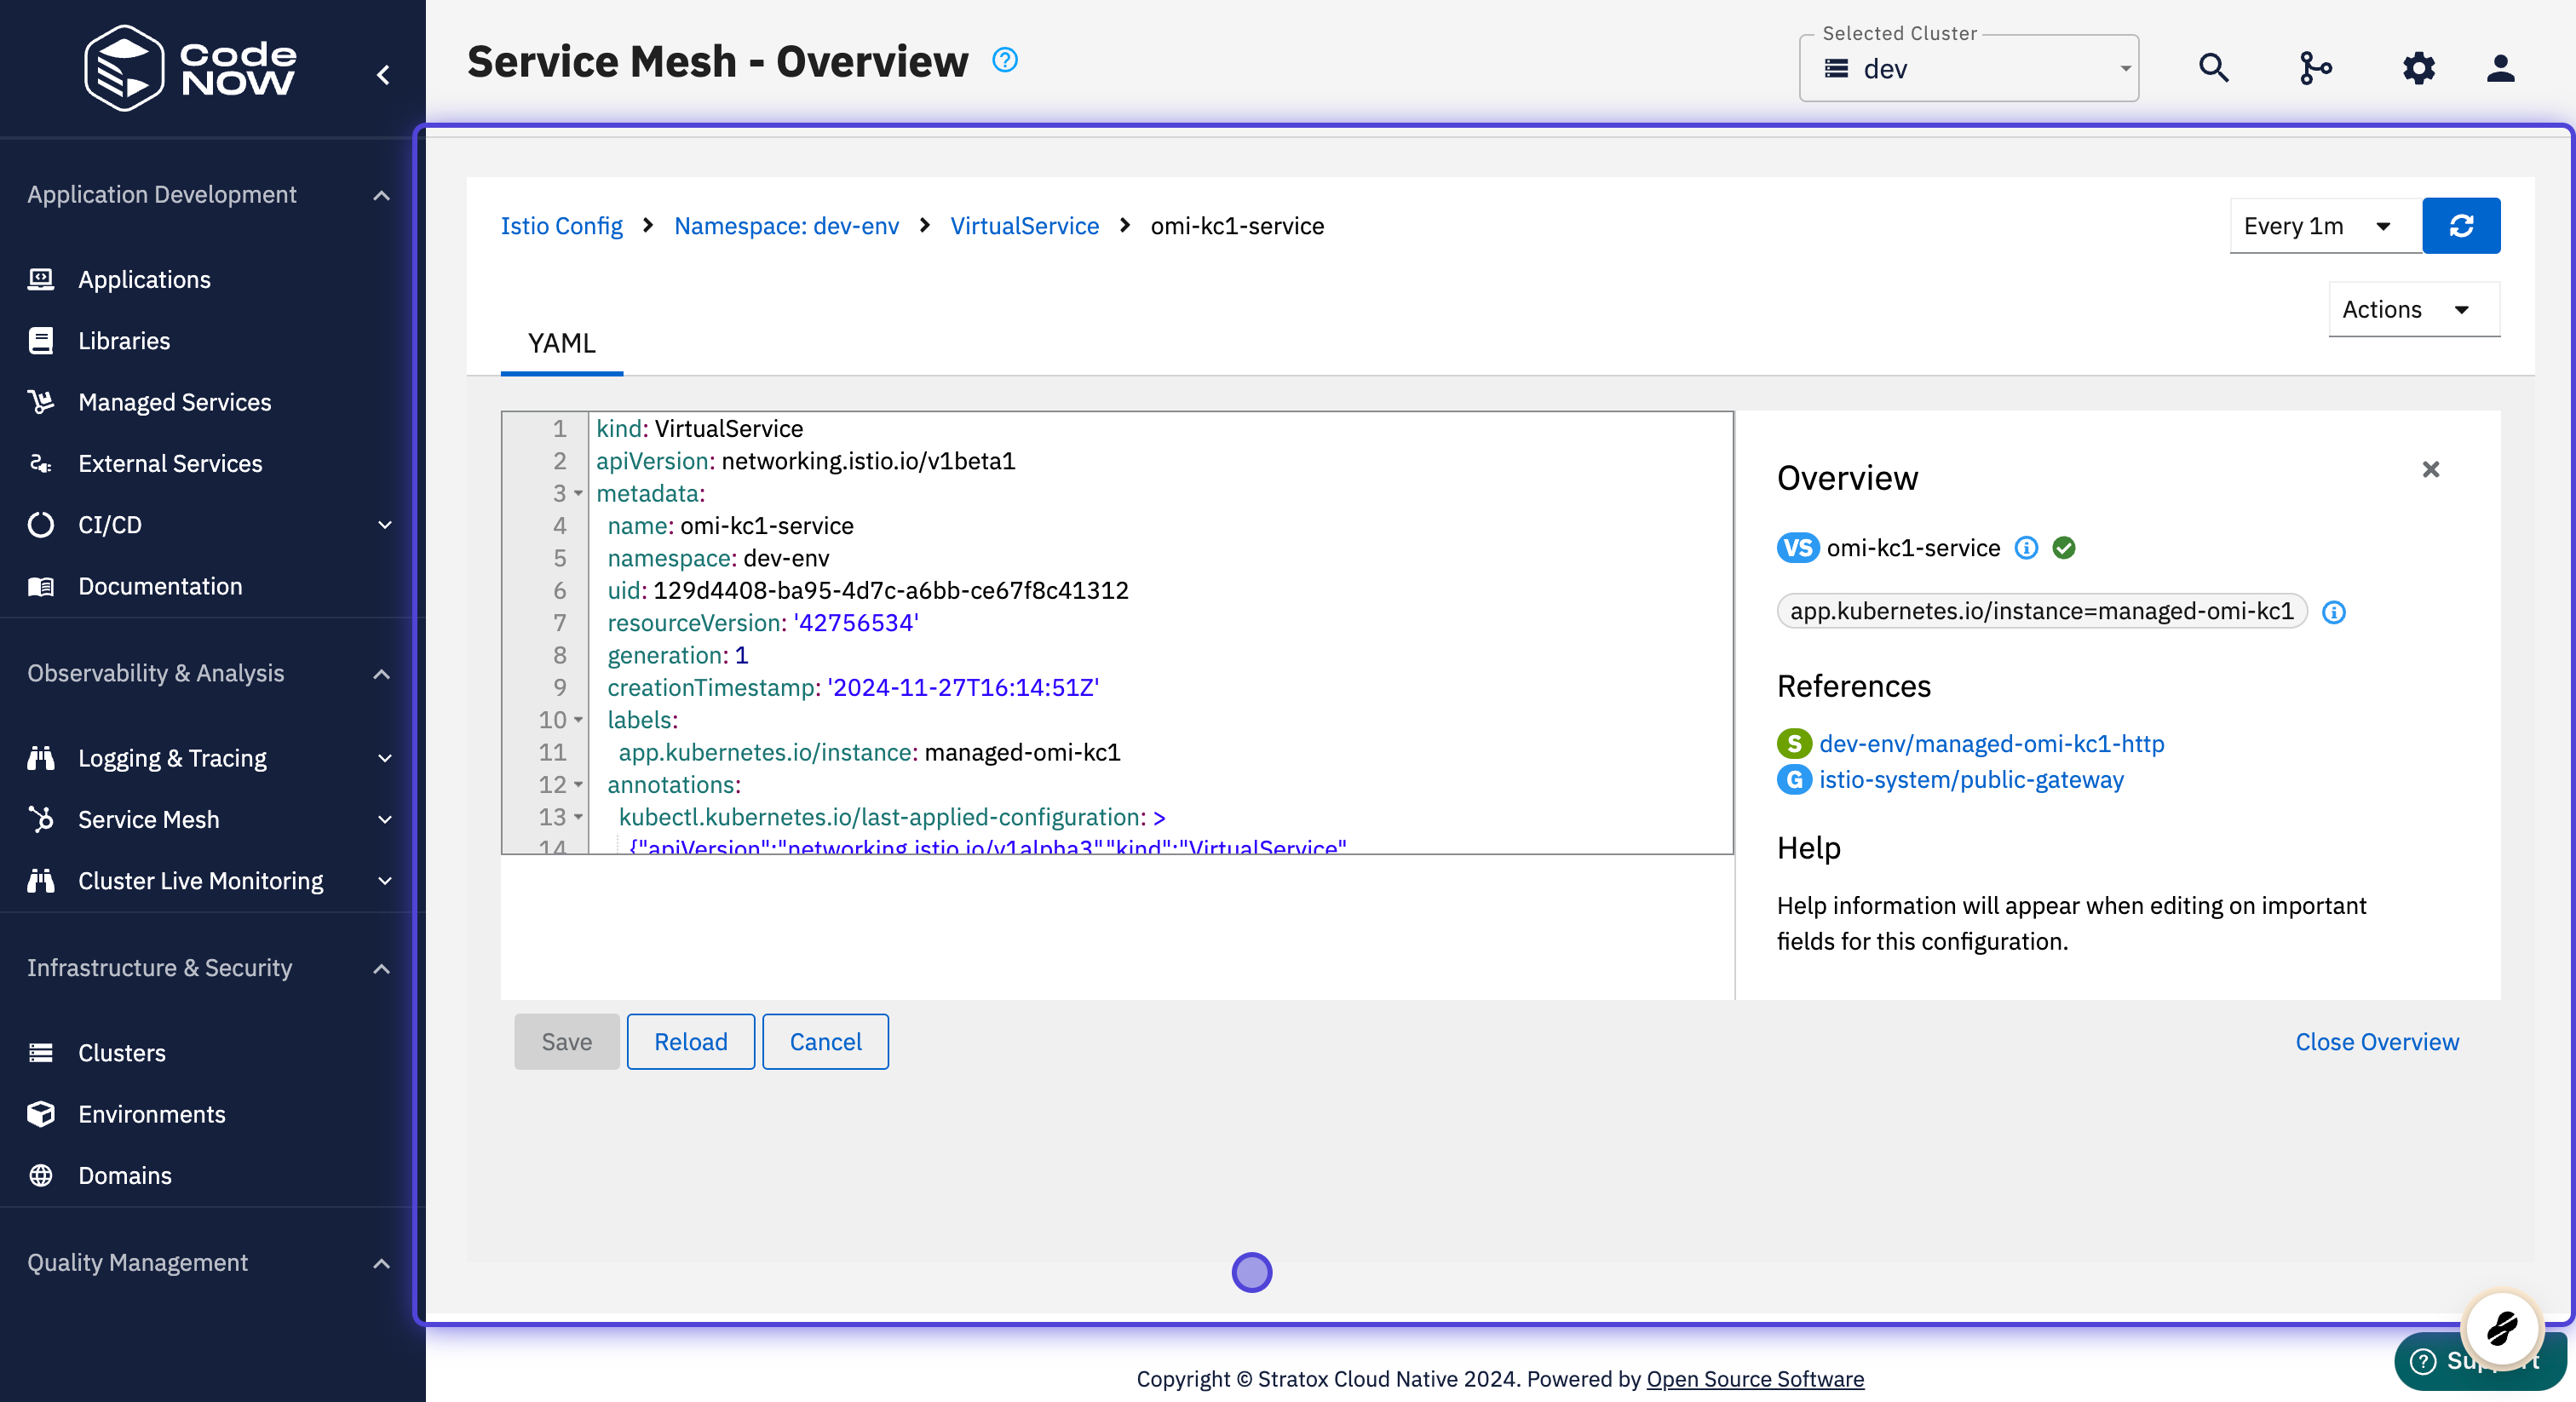
View the configuration of the selected virtual service
1 / 3