Static Analysis
🕓 15 minutes
What you’ll learn
How to thoroughly analyze your code to create a clear and professional application without bugs and security-related issues.
- For example:
- You can detect whether the code contains duplicated blocks or deprecated annotation/methods.
- Your code will be analyzed for OWASP and SANS security standards.
- The static analysis will count the unit tests and tell you the code coverage in your project.
Prerequisites
Outline
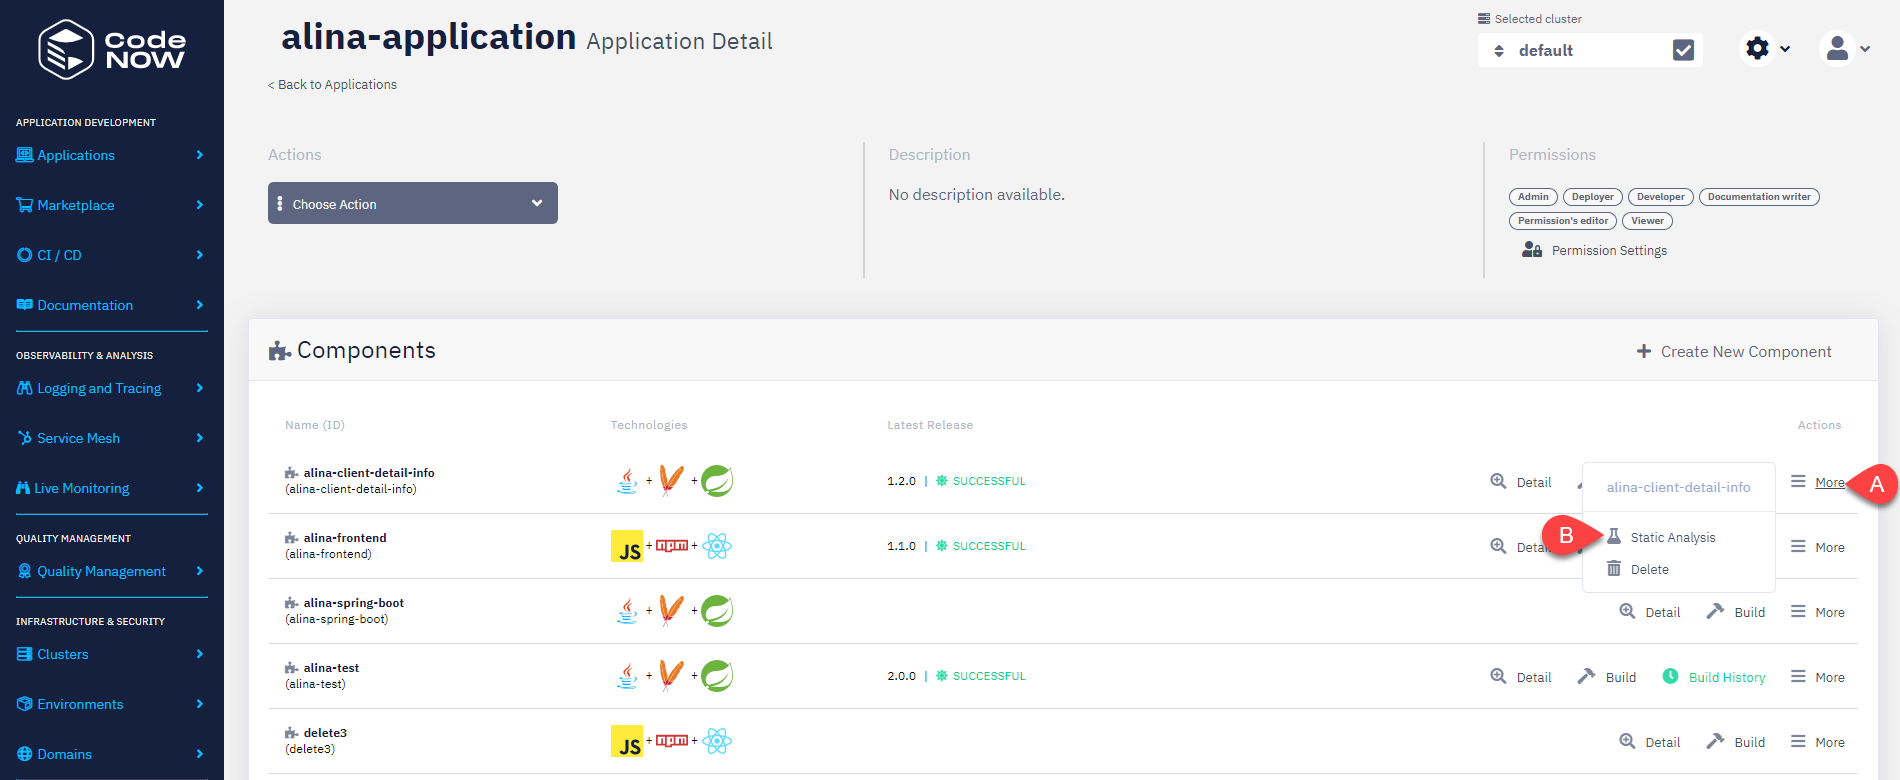
There are two ways of choosing an application component for static analysis:
-
Go to your application, select the "More" option, and then "Static Analysis".
- Here you will see the complete analysis of the chosen application component.
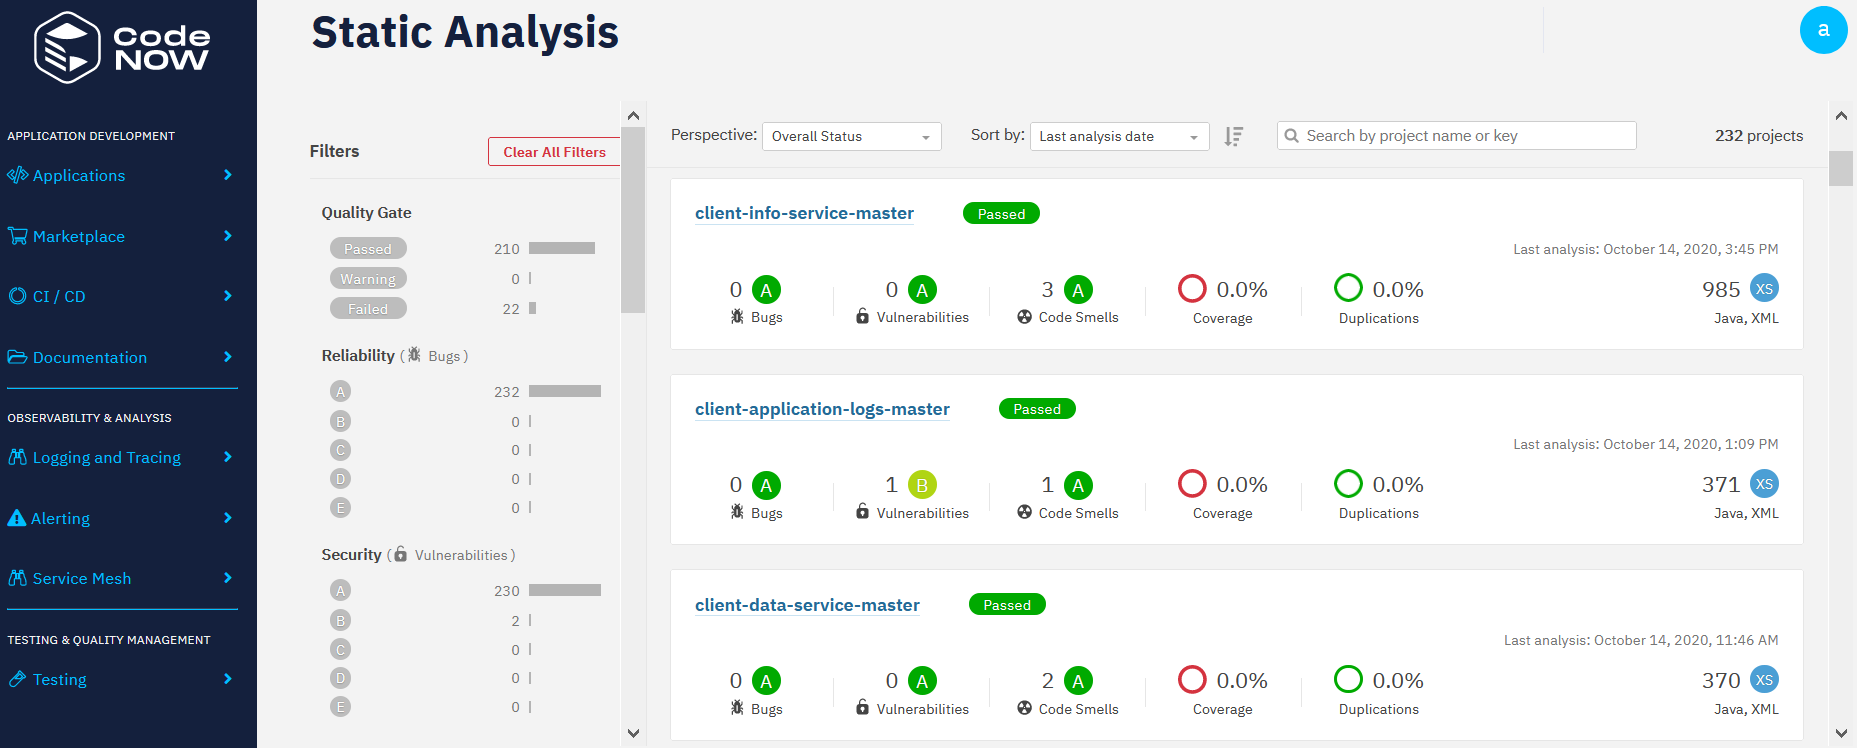
-
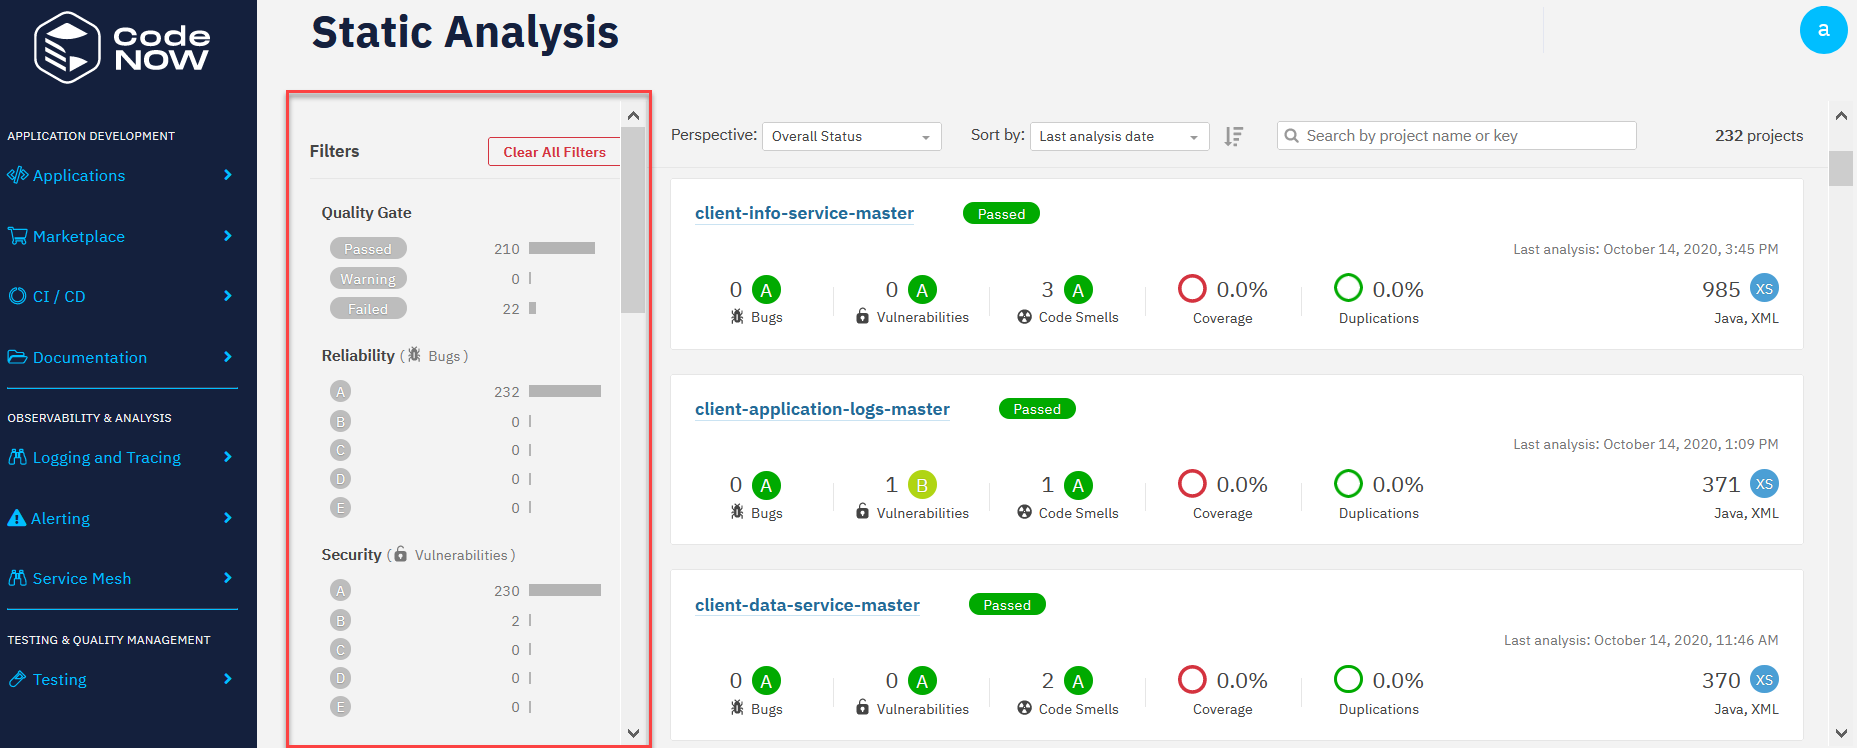
Find the "Quality Management" section and choose the "Static Analysis" option.
- There you will see all the created application components from every existing application.
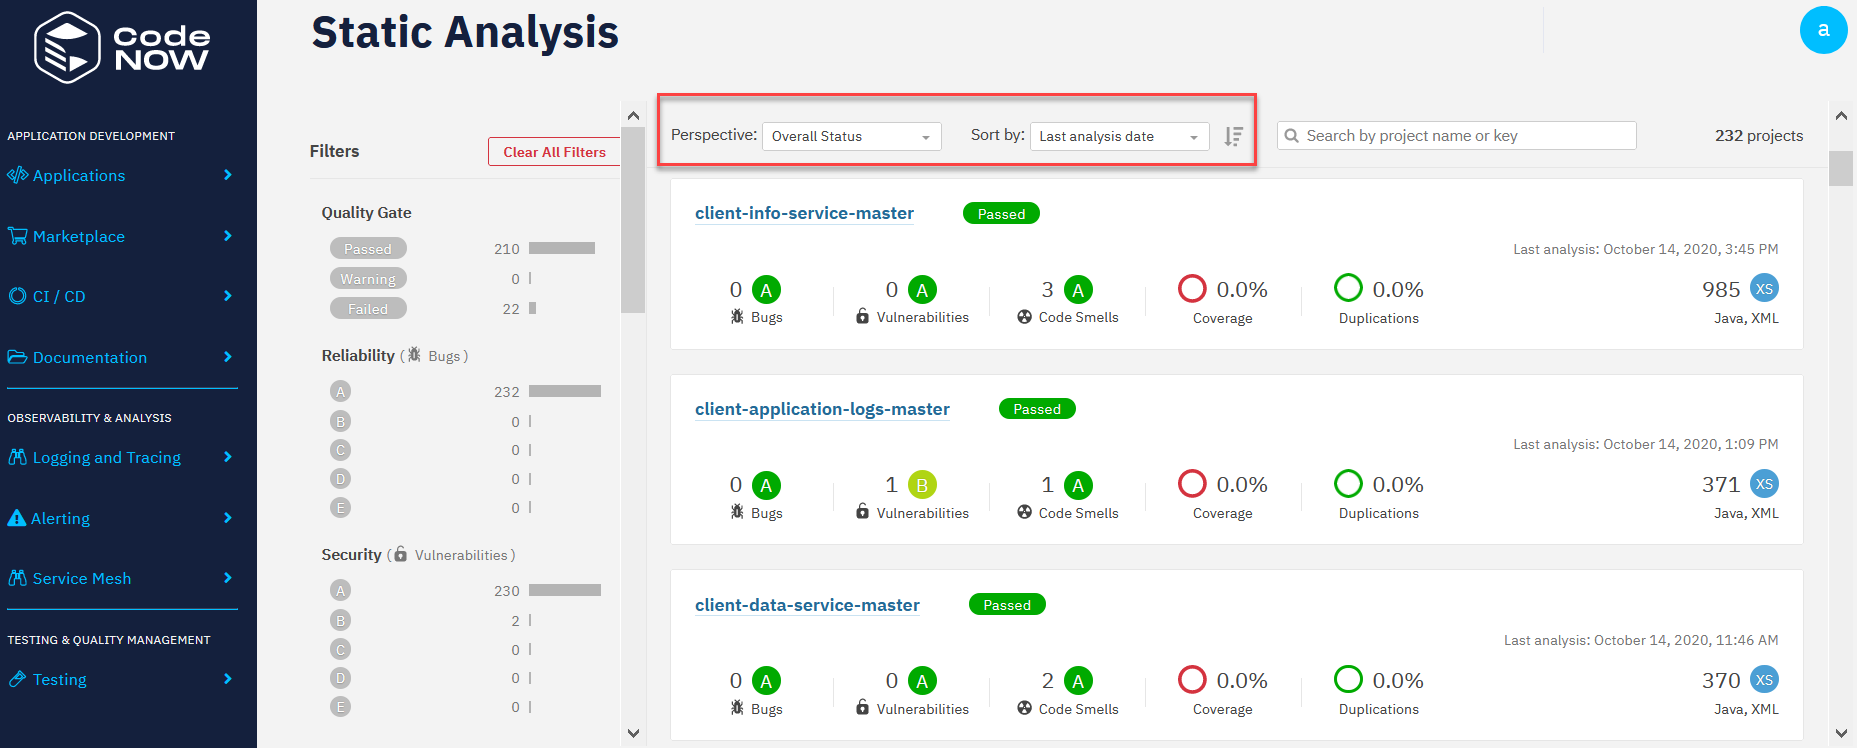
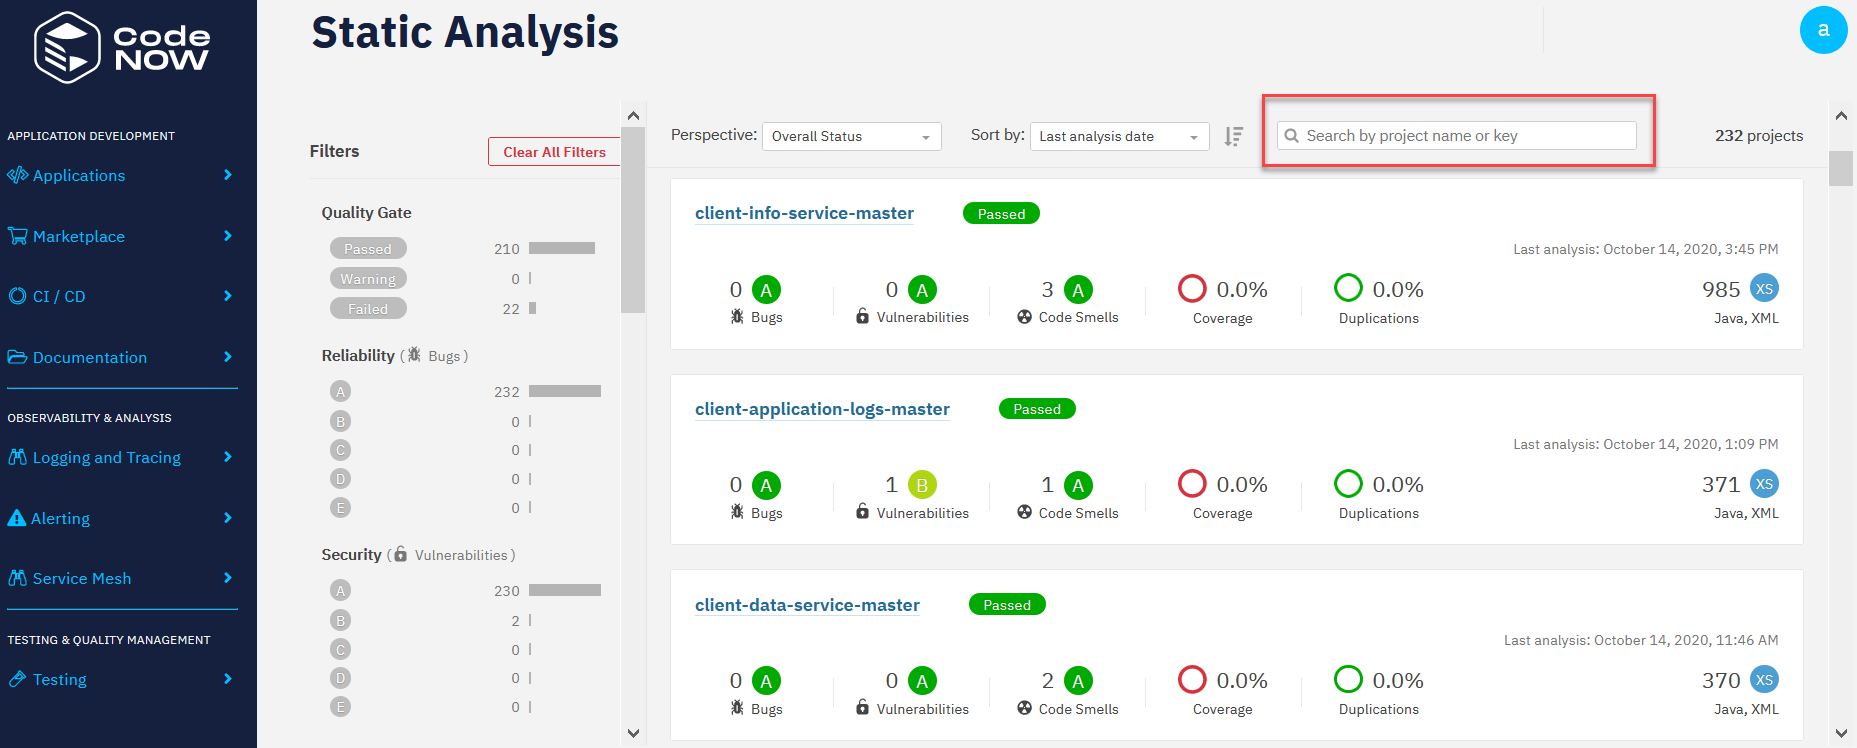
- You can sort and filter them by different parameters or simply type the needed component name into the search field.
- There you will see all the created application components from every existing application.
-
For the static code analysis, CodeNOW uses the SonarQube tool.
- You can read more about it here: https://www.sonarqube.org/about/
-
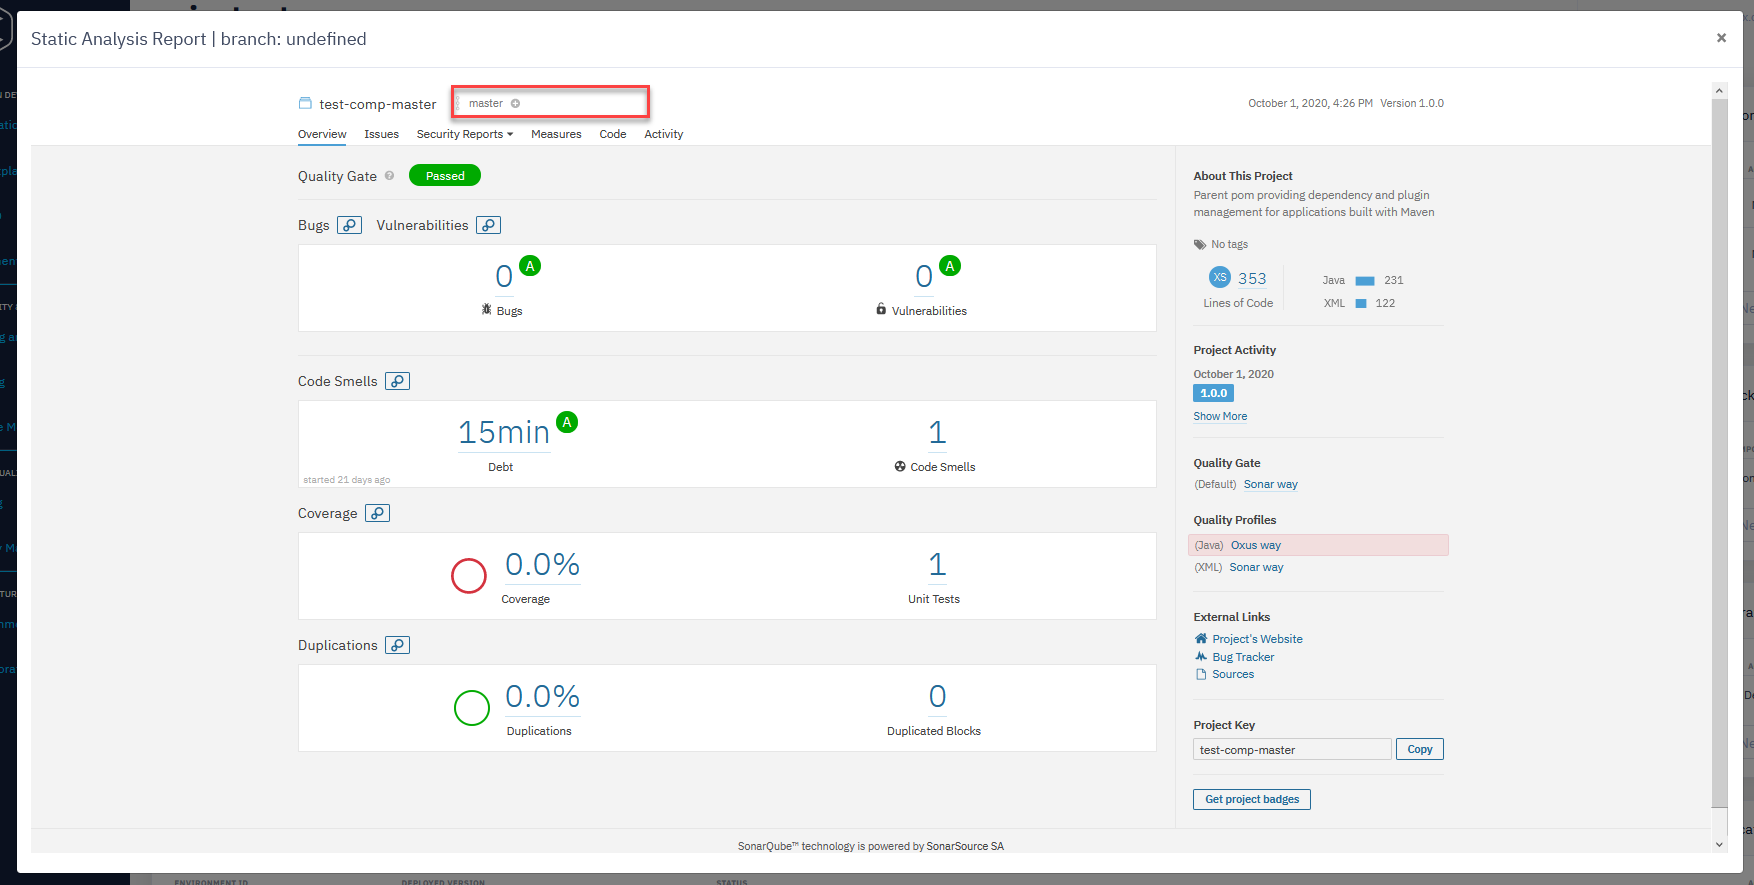
In the top right corner, you can see the last build version and time the application was built.
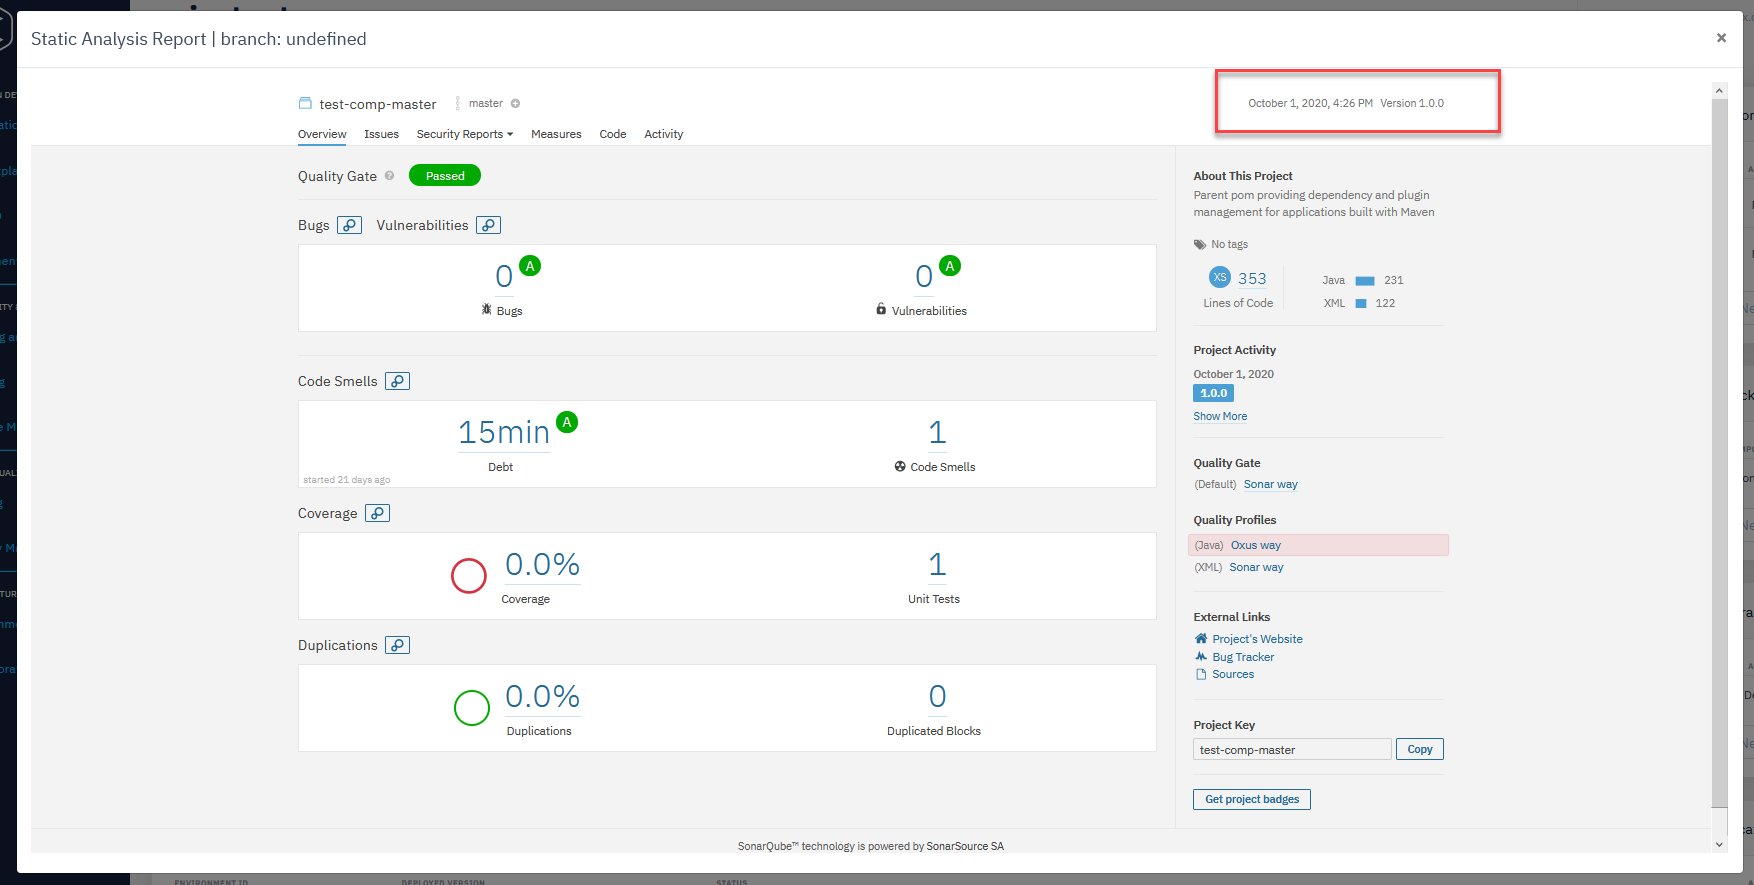
- You can also choose the branch that you want to be analyzed.
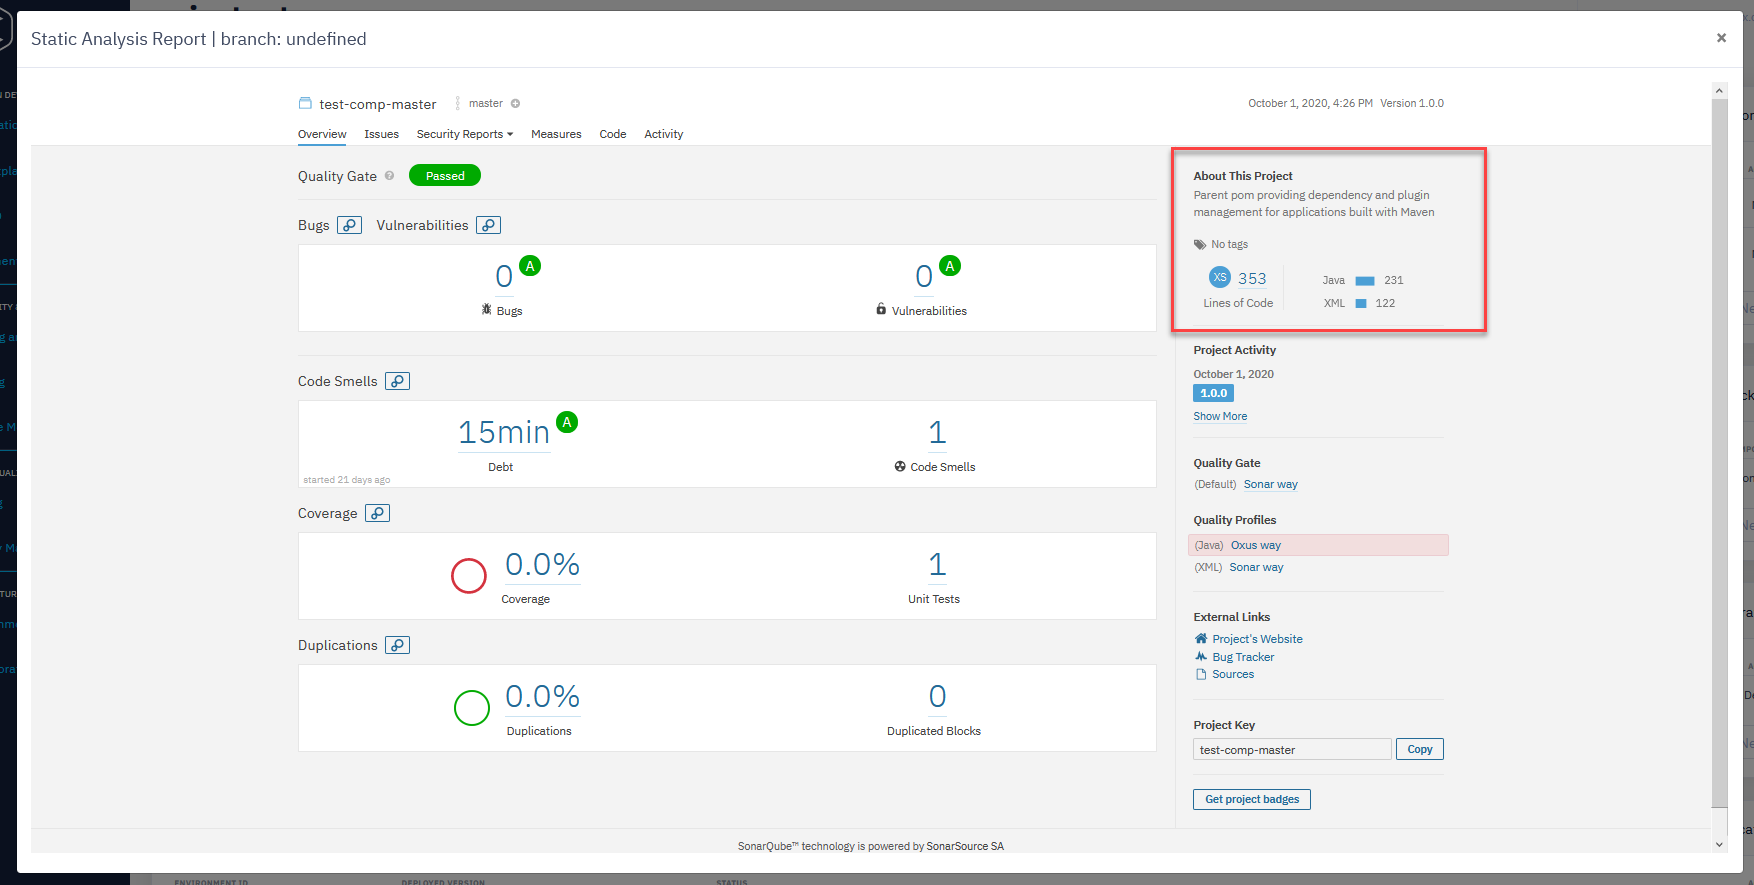
- In the right sidebar, you can see the base information about your component such as the number of lines of code, what languages were used, etc.
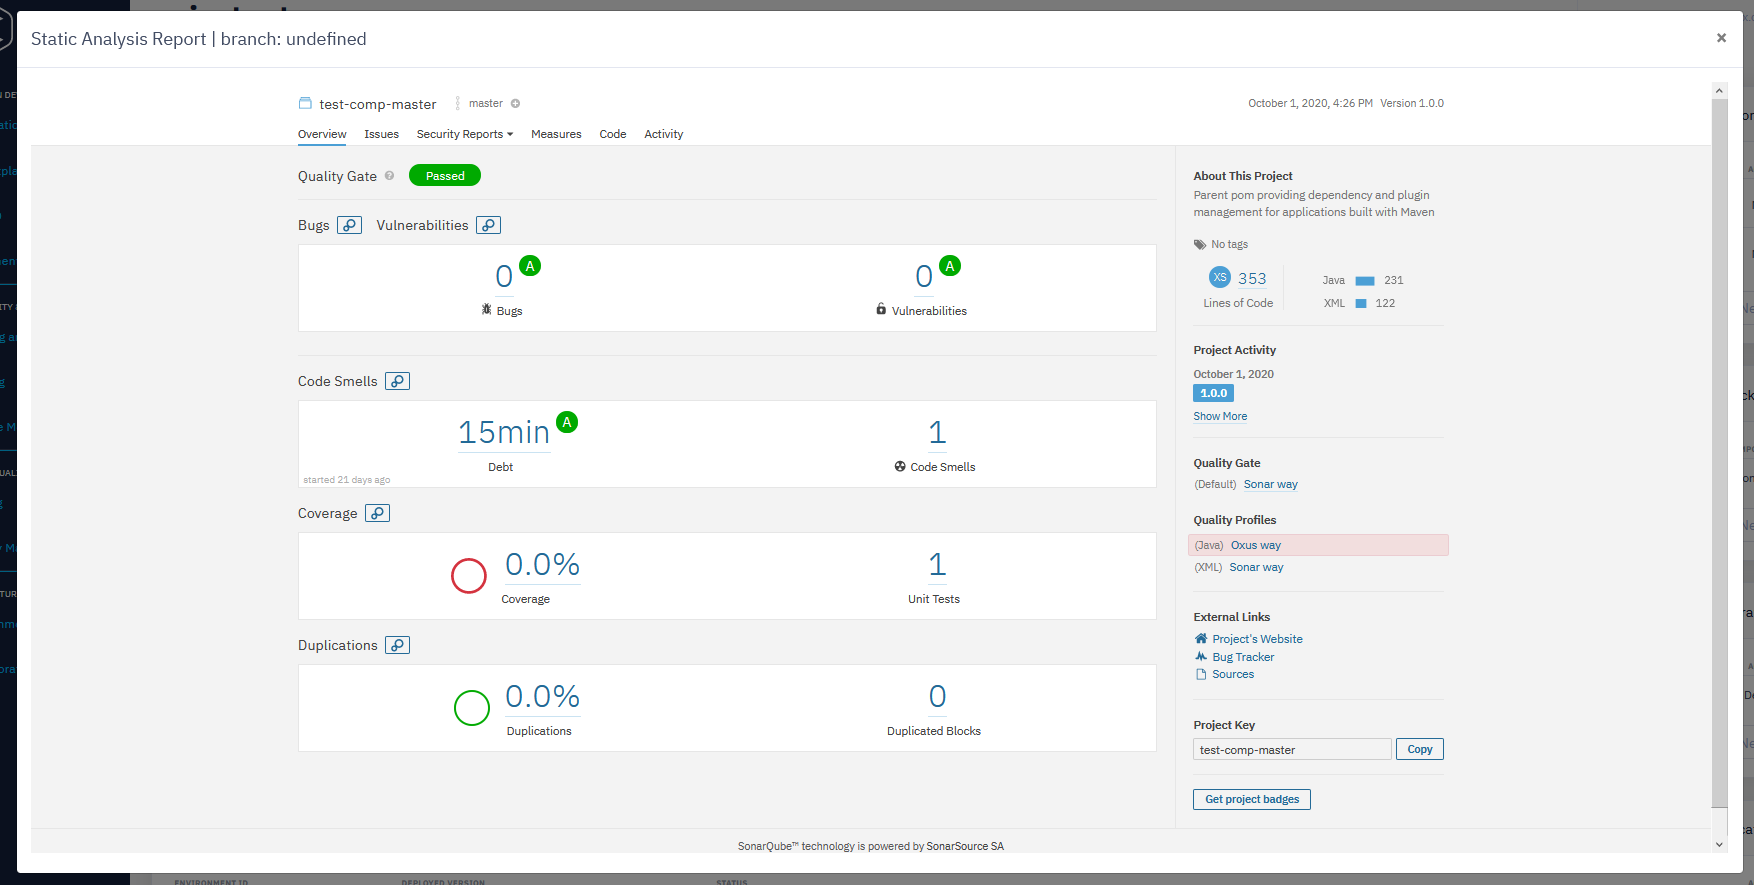
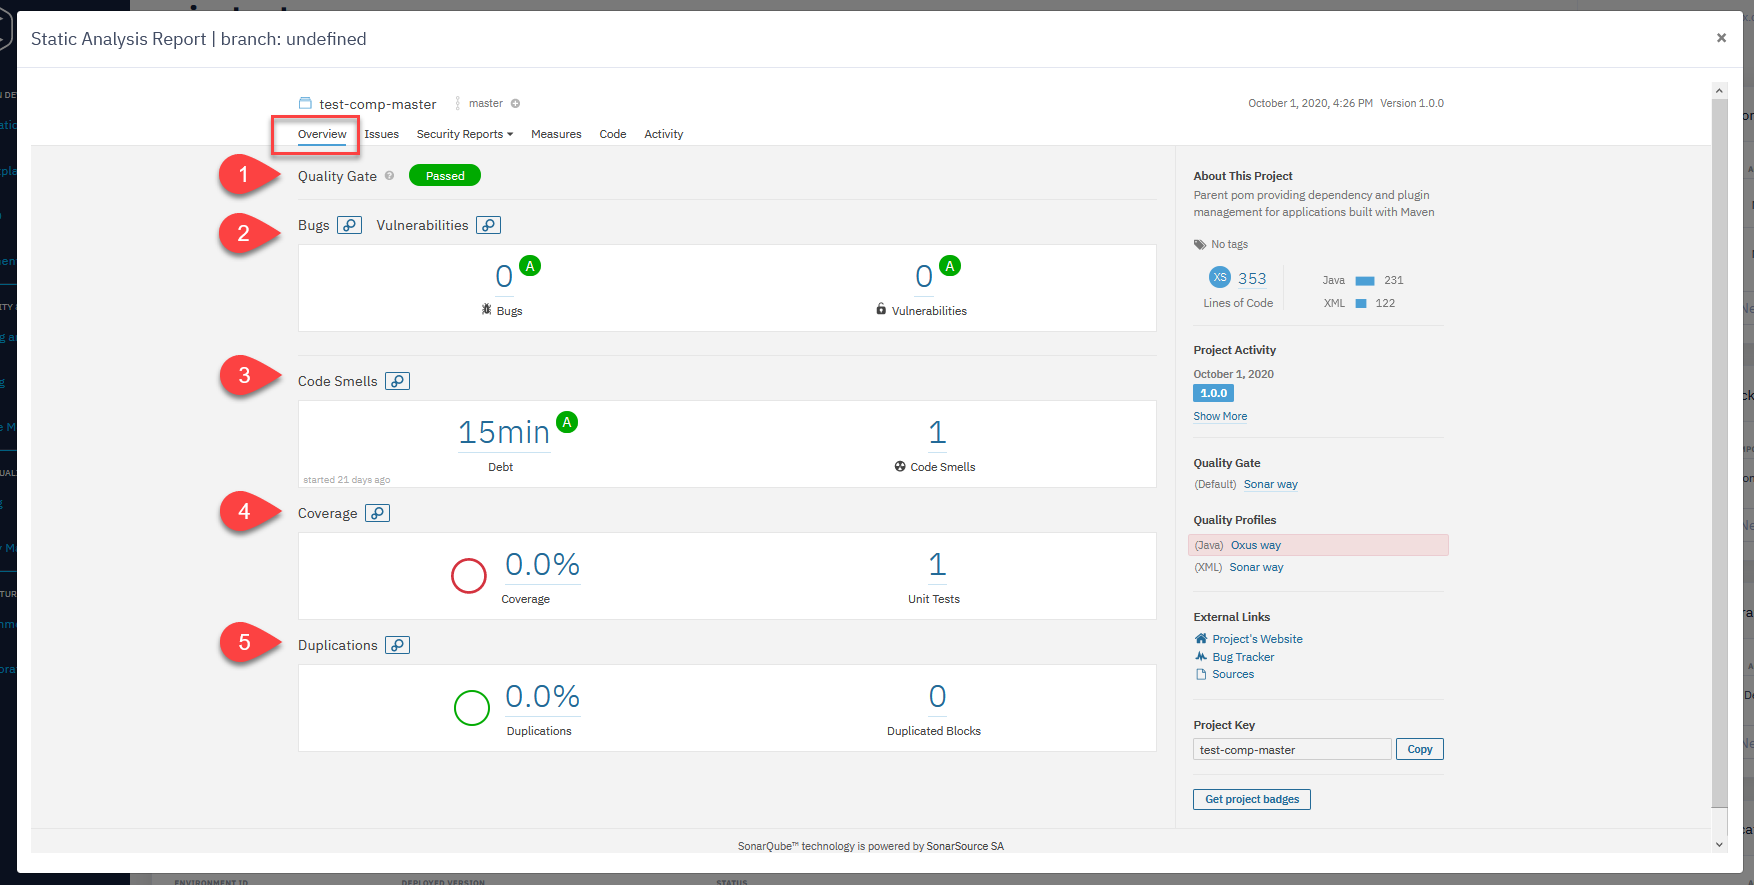
Overview section
- In this section you can see the basic information about your component:
- Quality Gate
- It helps you know immediately whether your project is production-ready.
- If the current status is not Passed, it will show you the measures that caused the problem and the values required to pass.
- Bugs
- Shows the number of bugs in the code.
- Vulnerabilities
- Shows the number of security-related issues in the code.
- Code Smells
- A maintainability-related issue in the code.
- Coverage
- Shows the number of unit tests in your project and how the code is covered by them.
- Duplications
- Shows the number of duplicated blocks of code in the project.
- Quality Gate
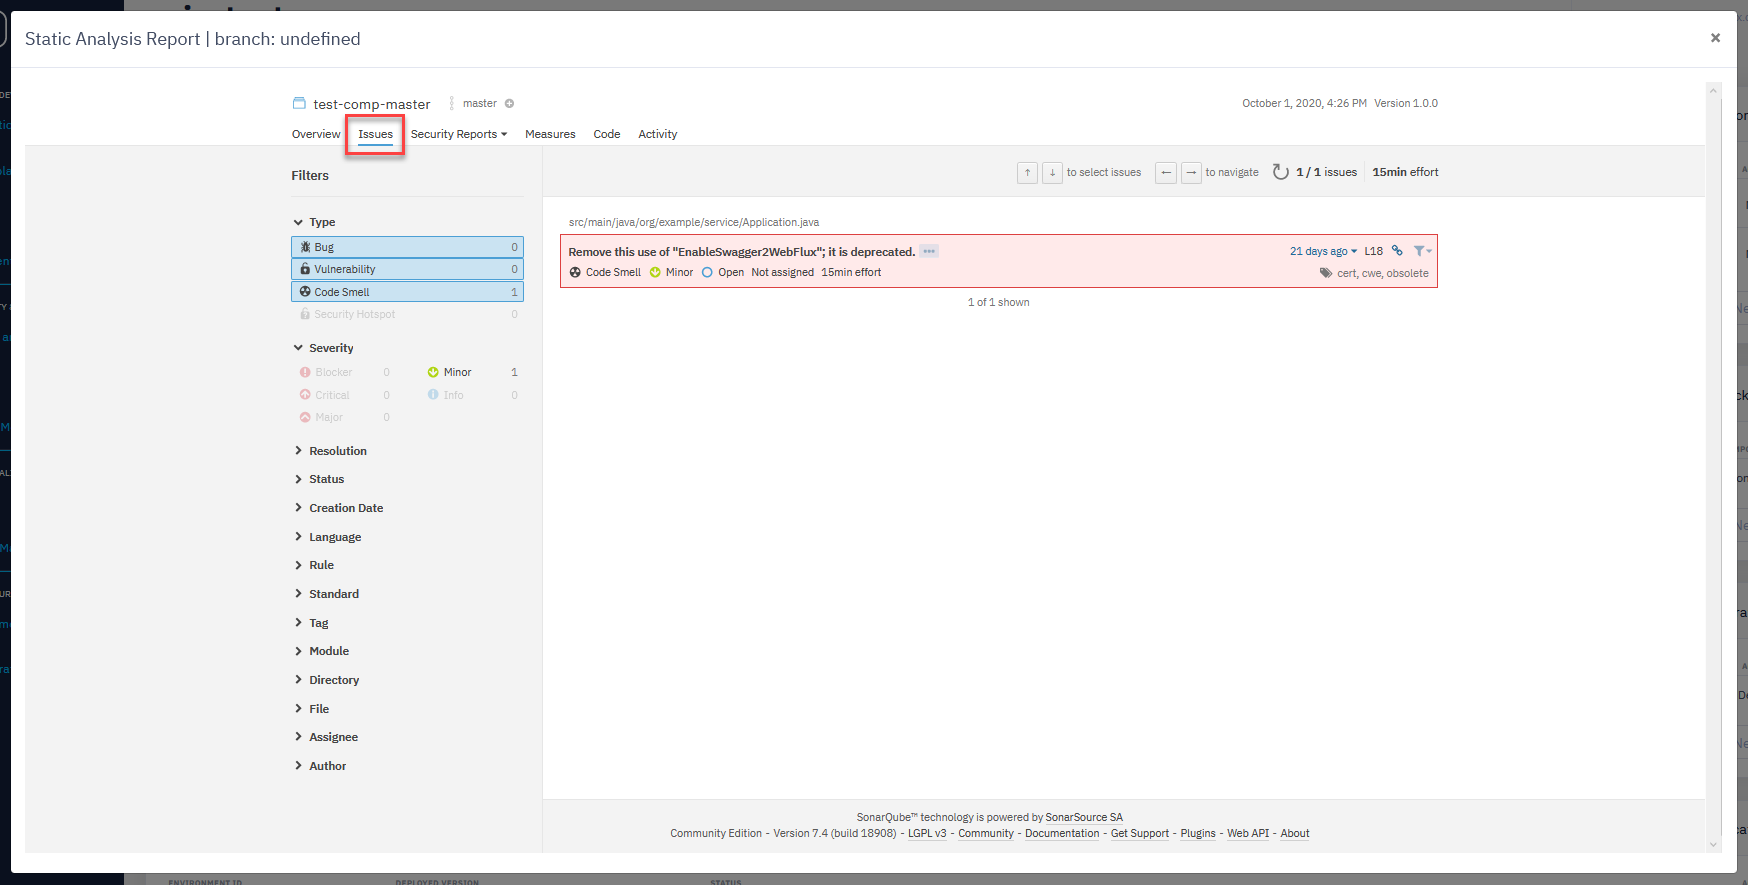
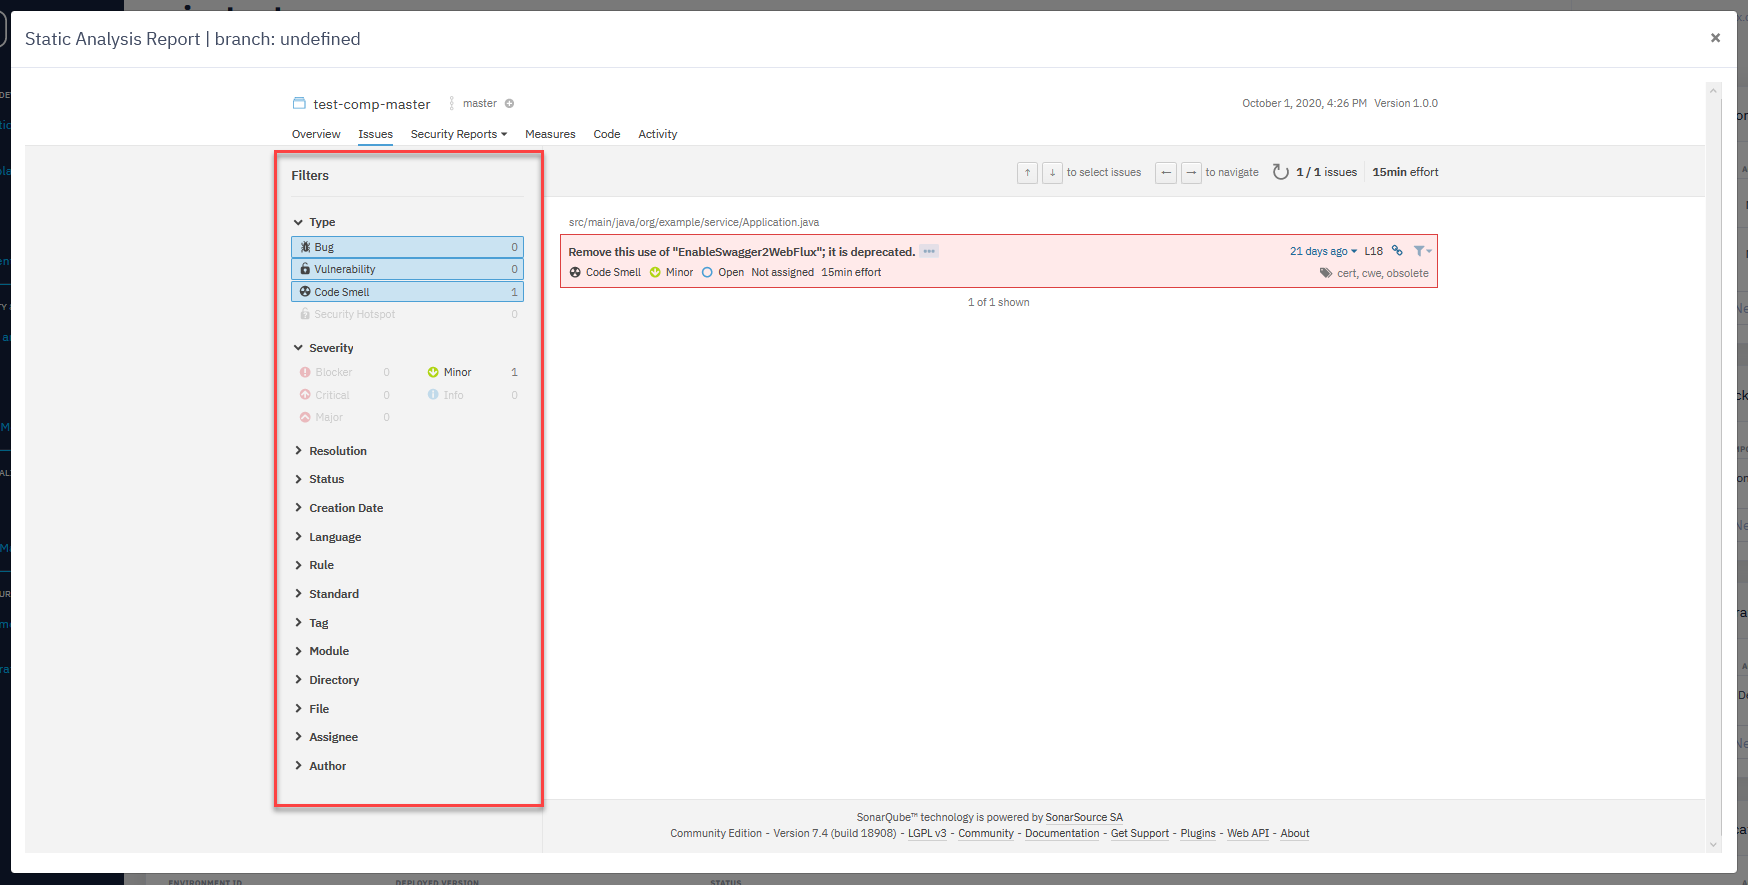
Issue section
- In this section, you can see all the open issues in your code.
- You can select them by different parameters such as type, status, creation date, and more.
- You can find all of them in the left sidebar menu.
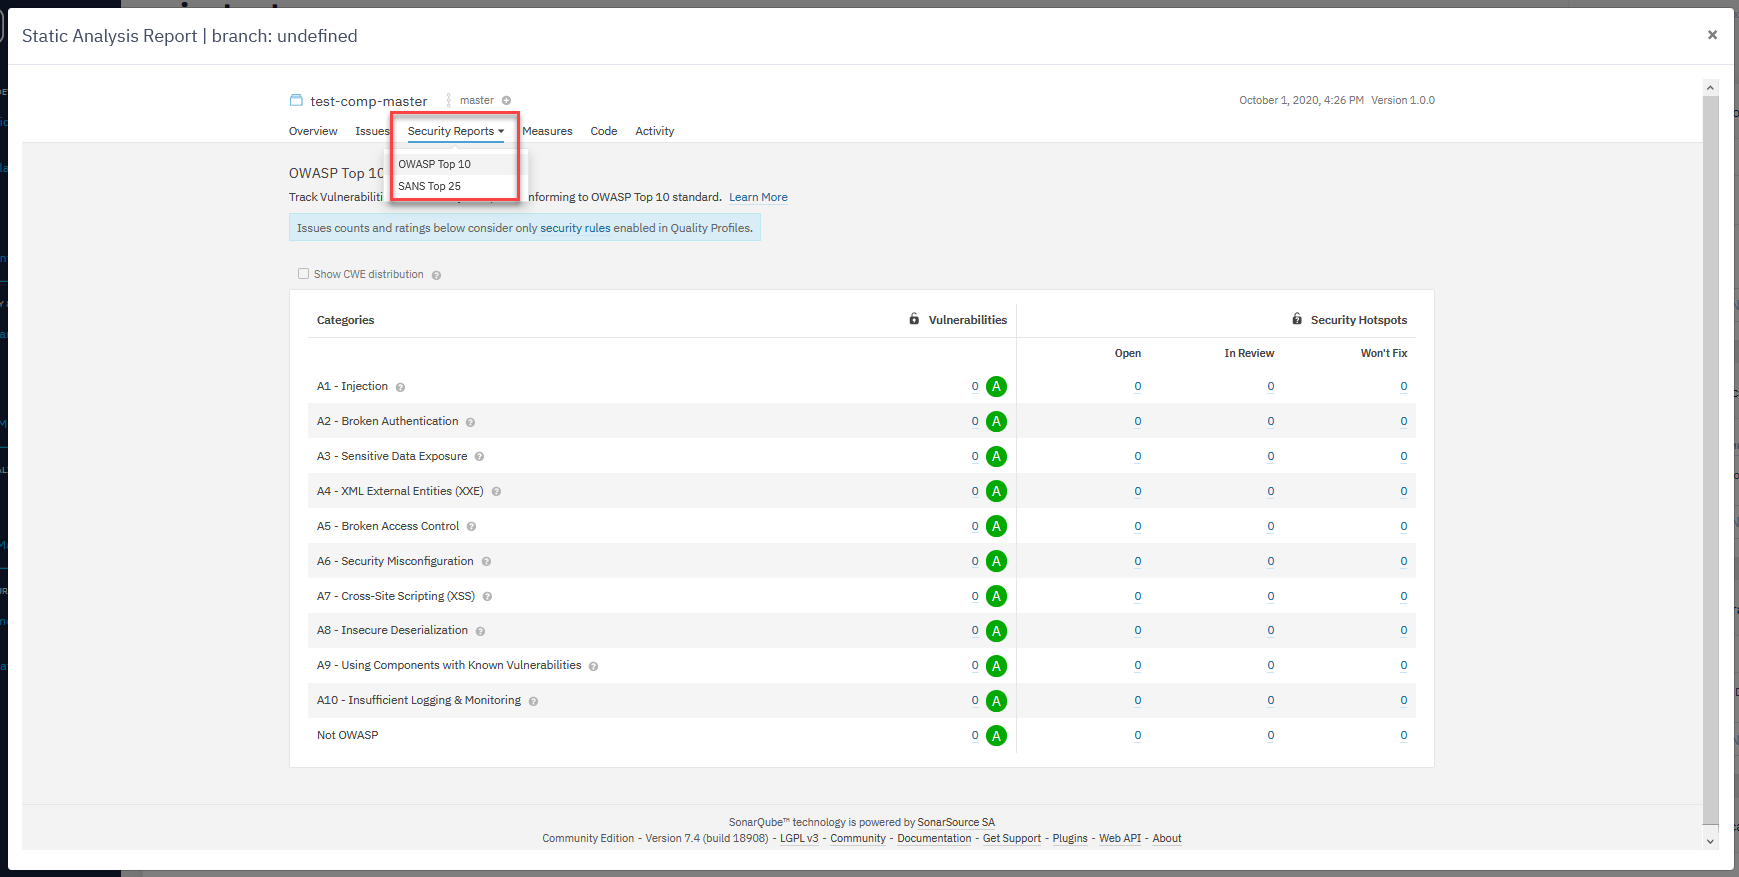
Security Reports section
- This section contains security vulnerabilities in your code.
- You can check them by OWASP Top 10 or SANS Top 25.
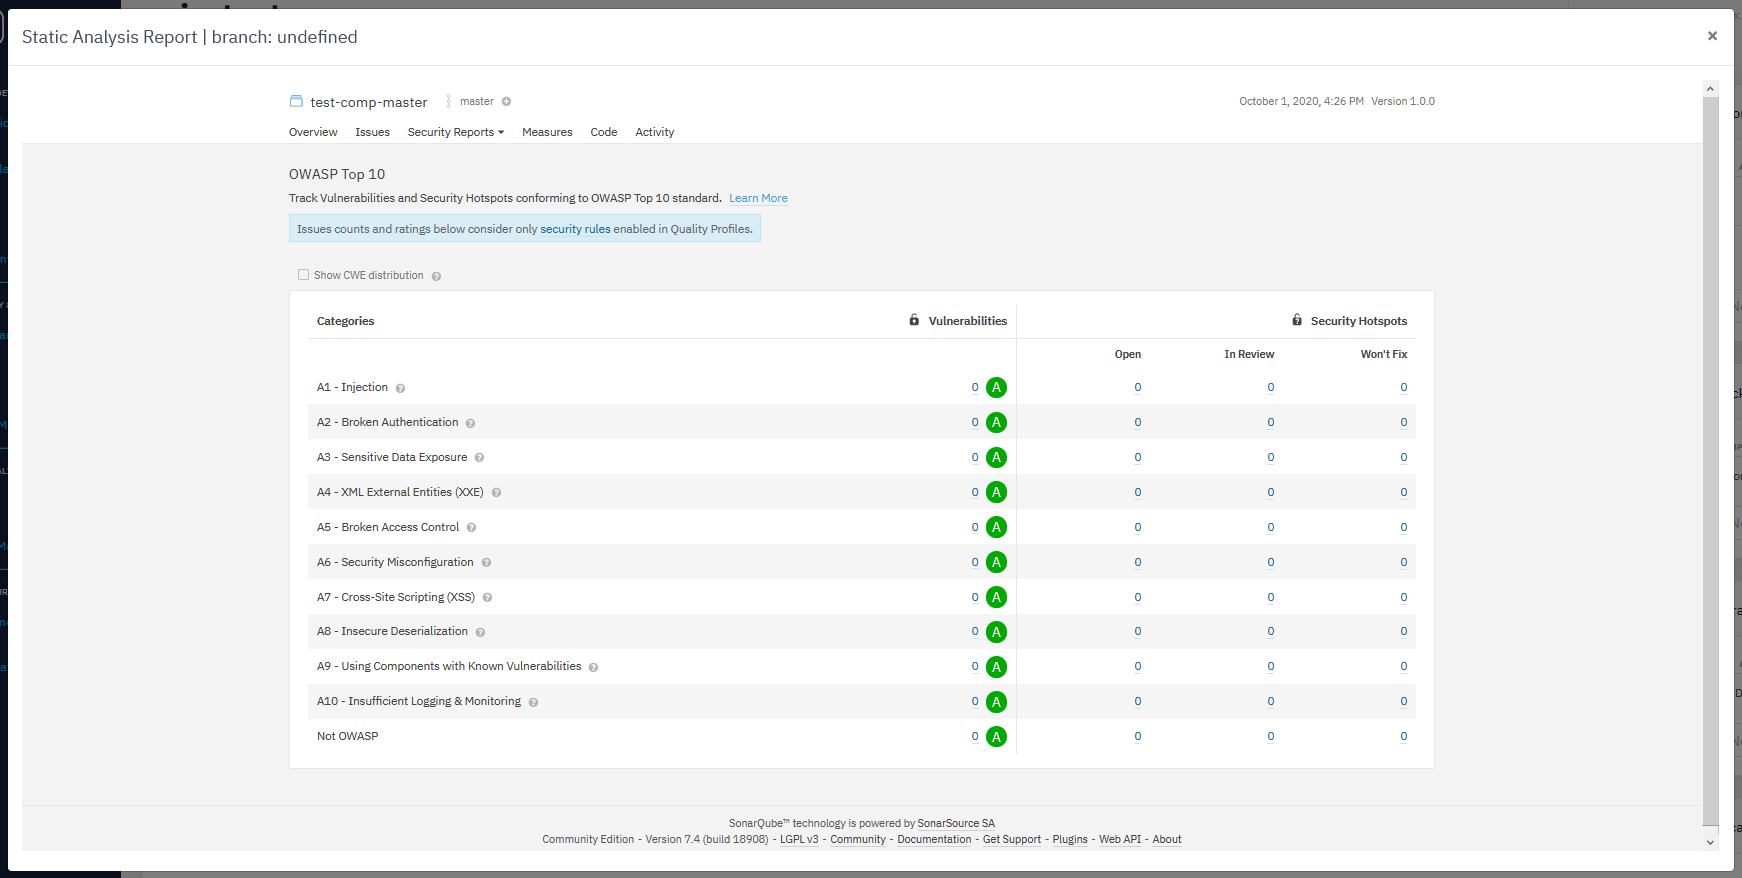
OWASP Top 10
- This is a standard awareness document for developers and web application security.
- It represents a broad consensus about the most critical security risks to web applications.
- For more information, see: https://owasp.org/www-project-top-ten/
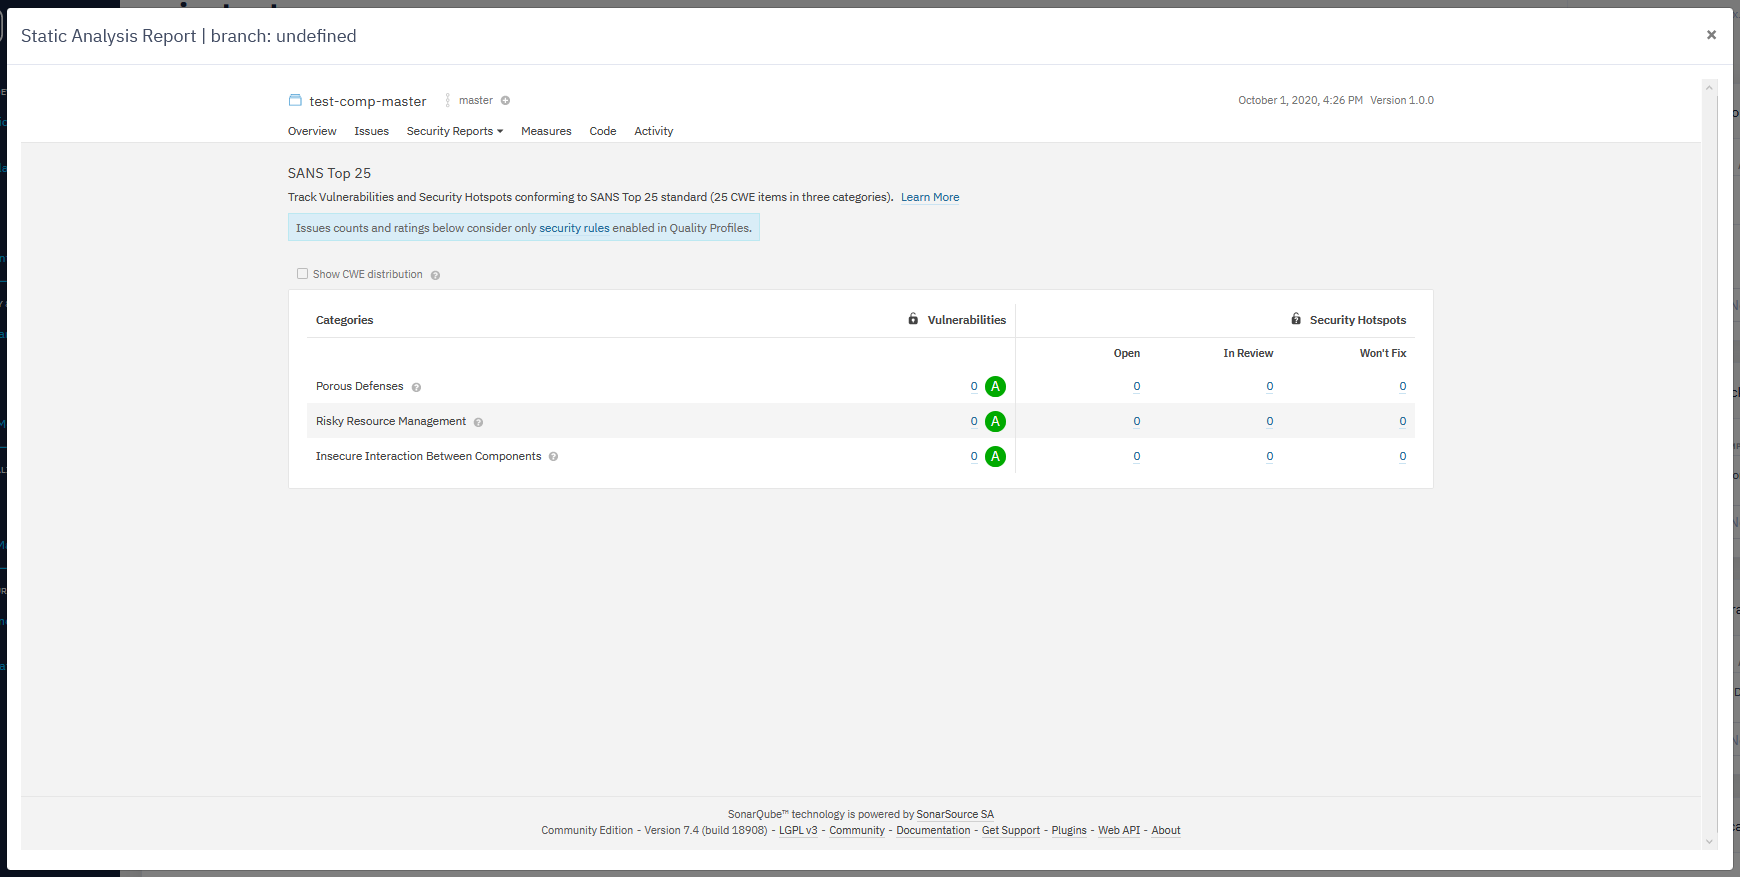
SANS Top 25
- The SANS Top 25 list contains the most dangerous software errors.
- For more information, see: https://www.sans.org/top25-software-errors
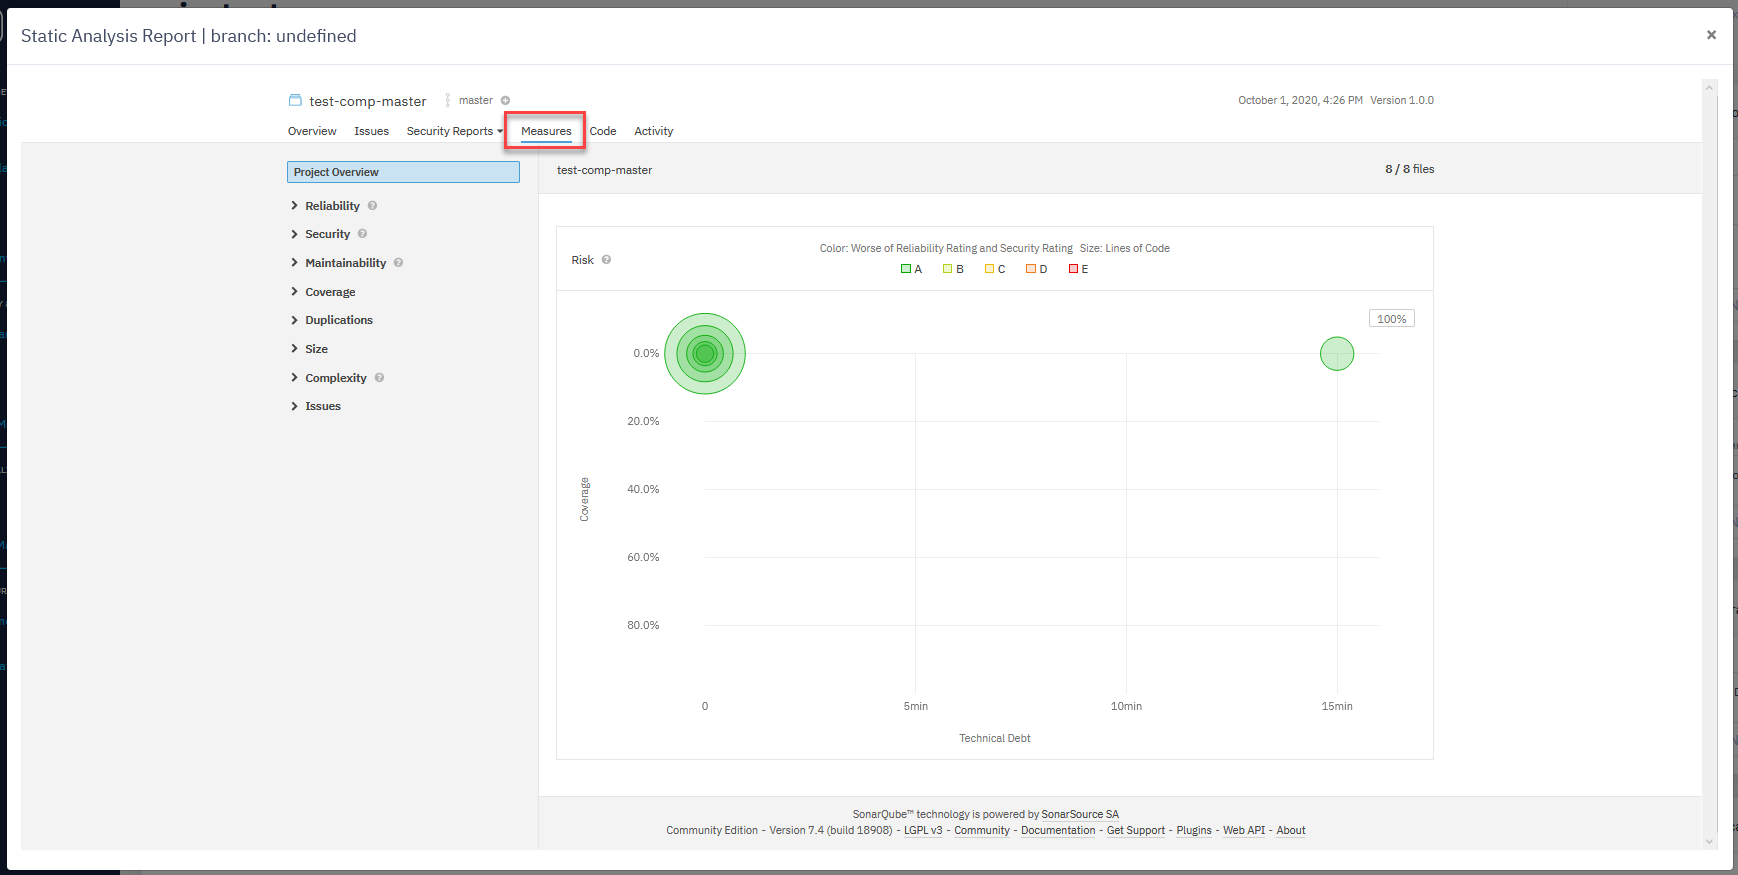
Measures section
- This section contains the value of a metric for a given file or project at a given time.
- For example, 125 lines of code on class MyClass or density of duplicated lines of 30.5% on project myProject.
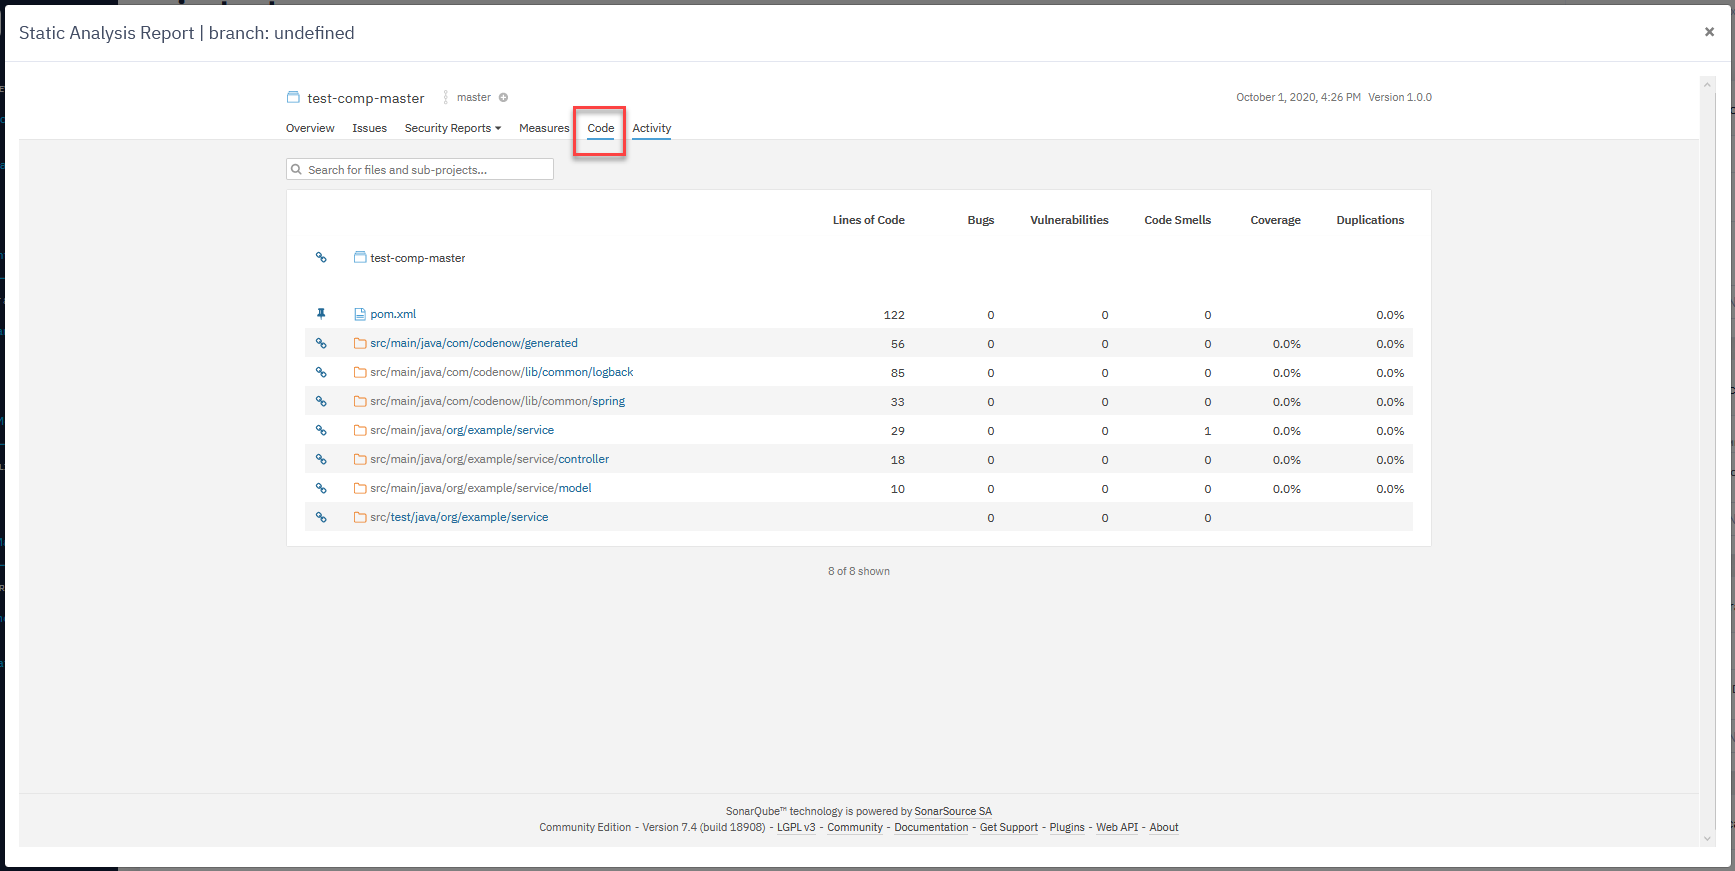
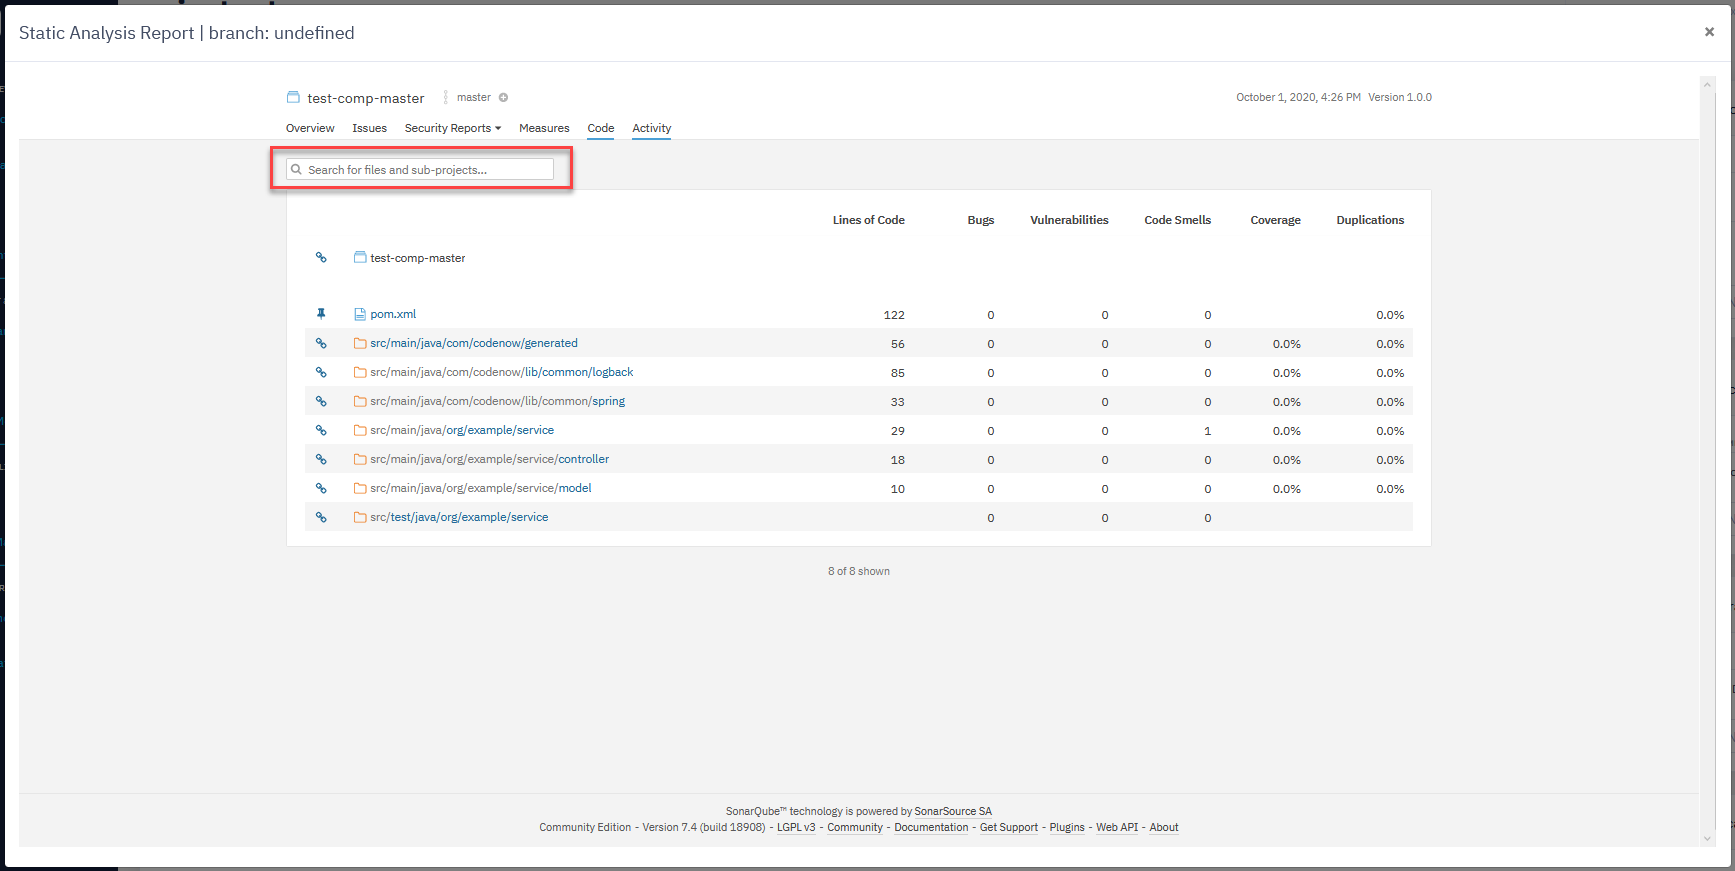
Code section
- Here you can find an analysis for every part of your code.
- You can search through the code hierarchy.
- You can search for files and sub-projects using the search field.
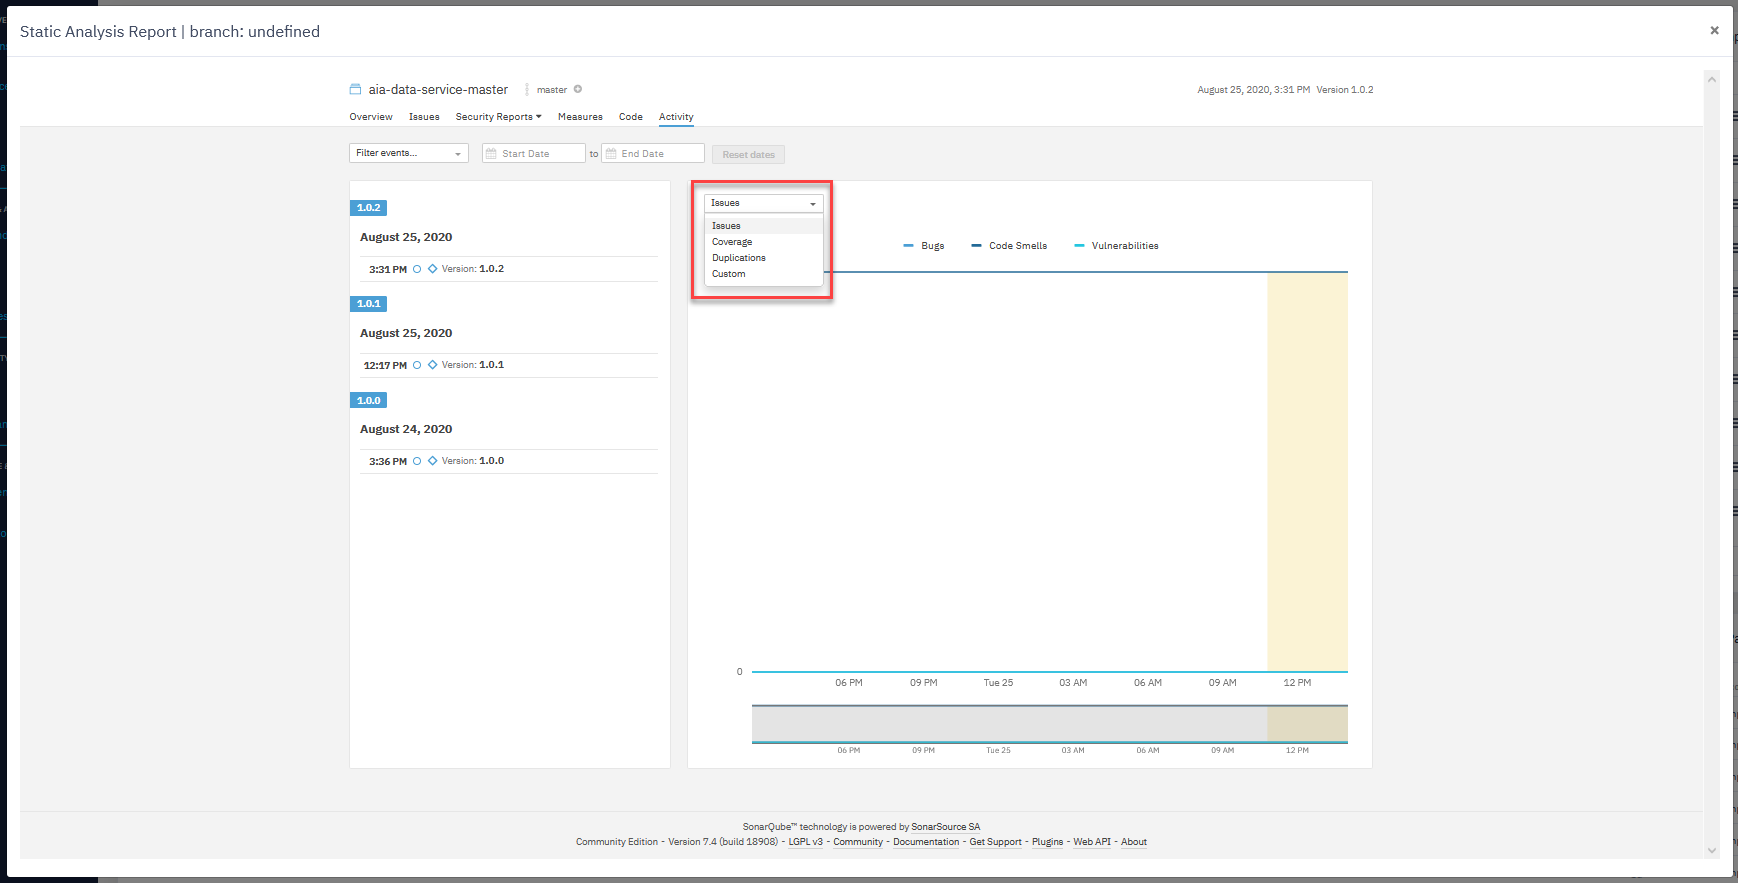
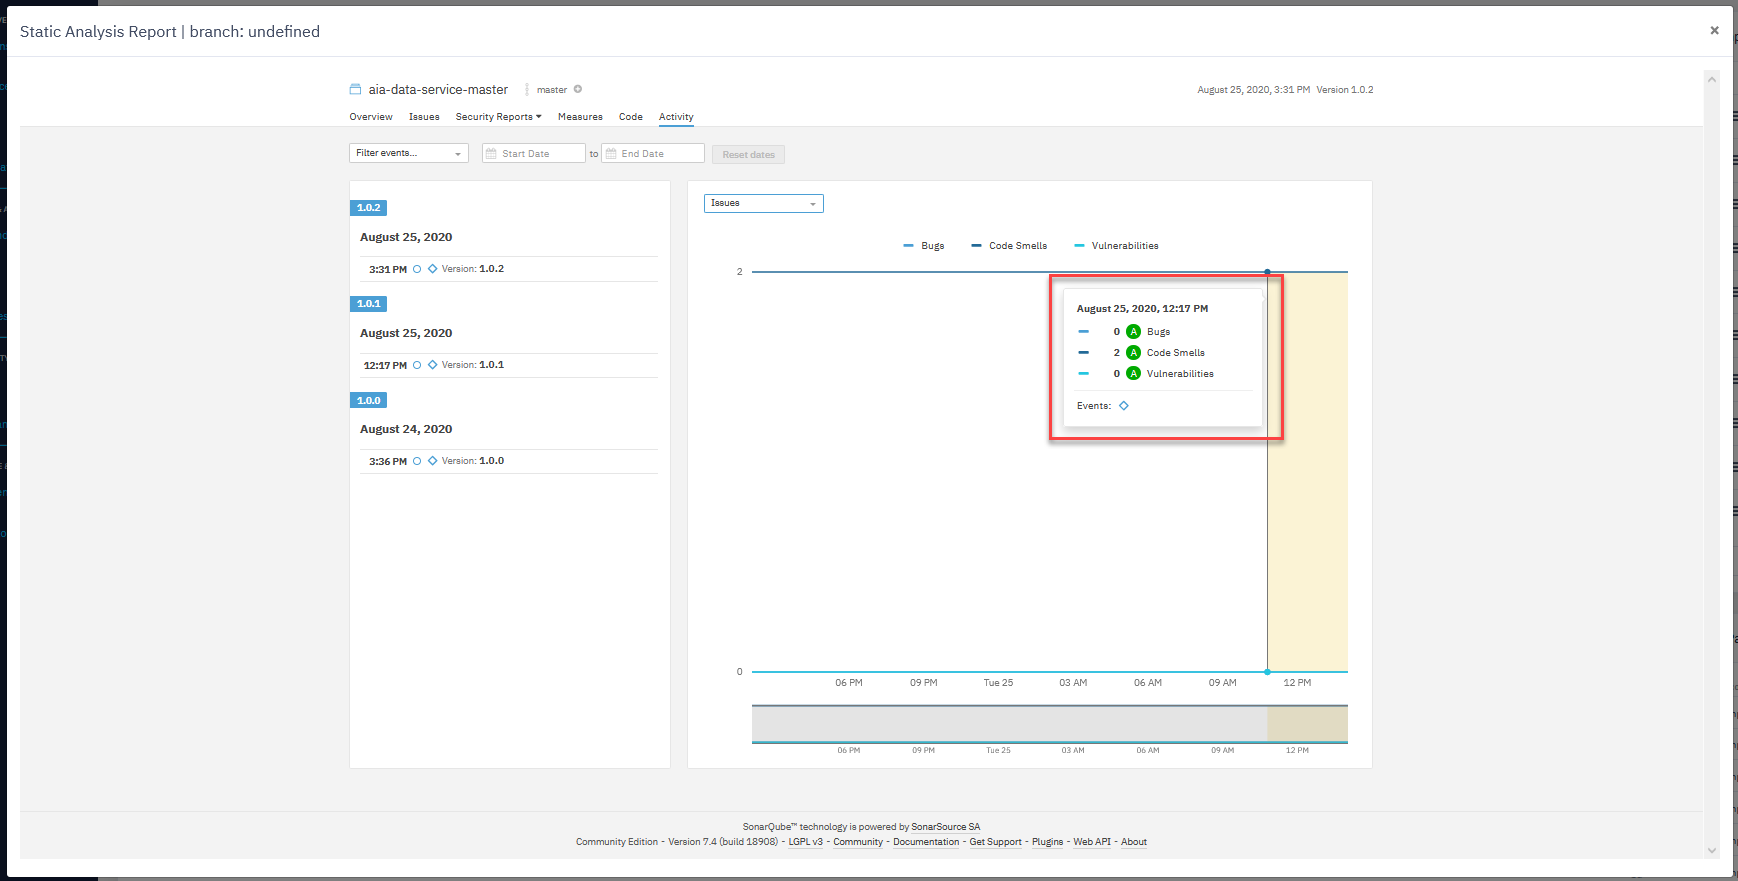
Activity section
- The Activity page offers to see the evolution of the project over time (with each new build).
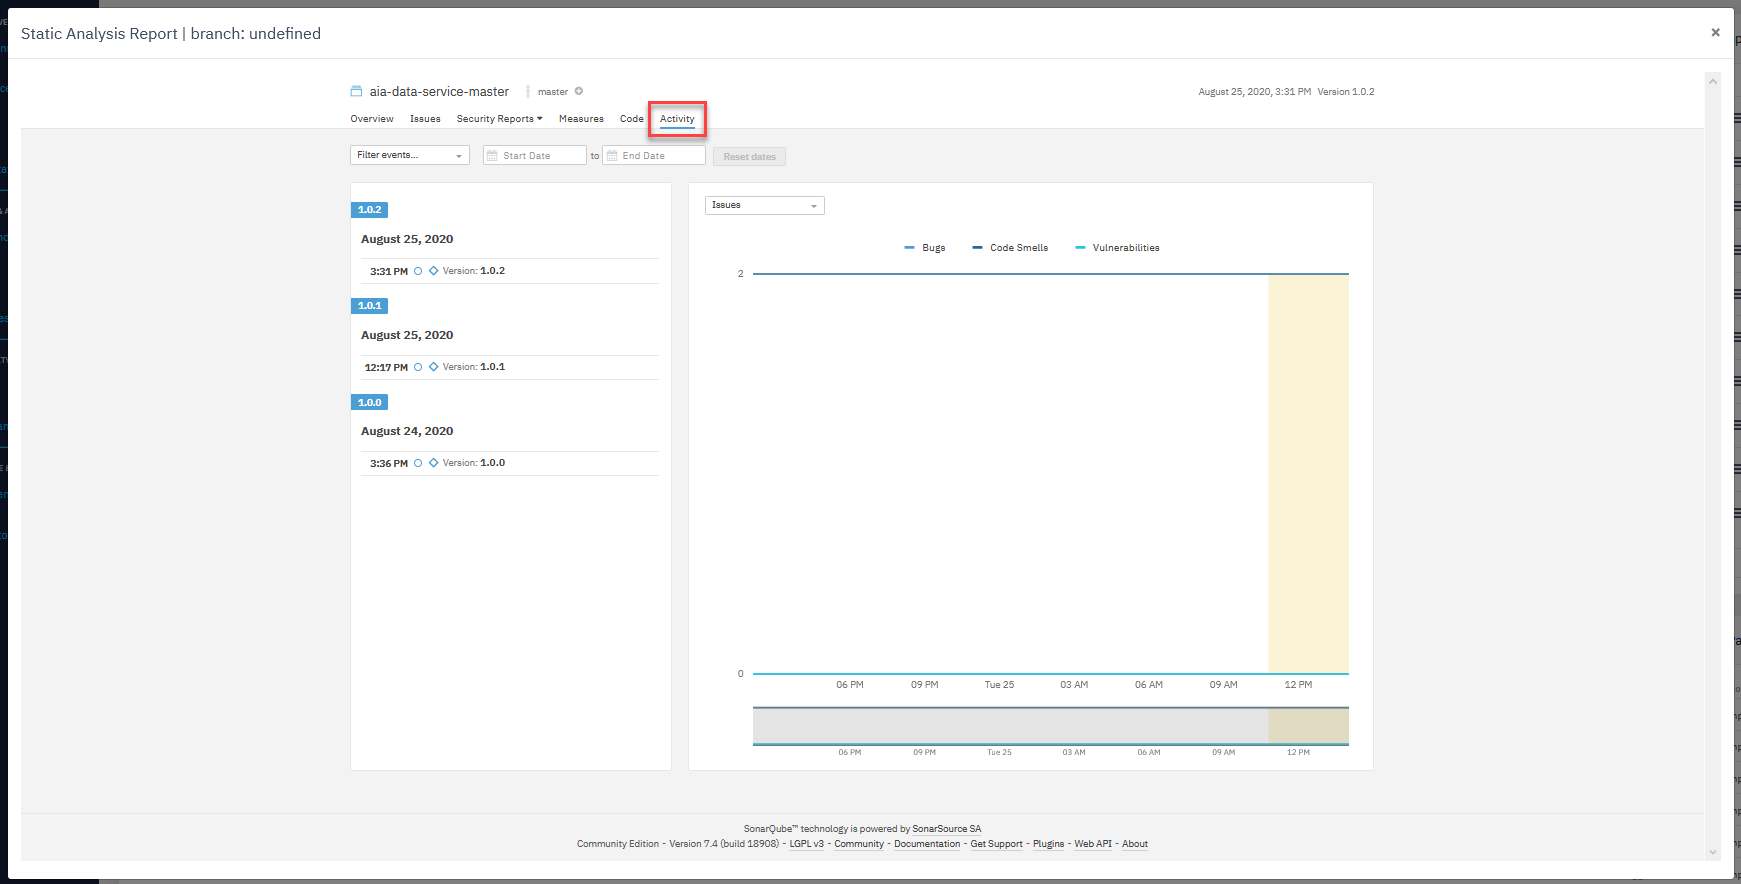
- Graphs on the activity page help you understand the evolution of up to three measures of your choice against each other.
- Graph mouseovers show the measure values and events associated with particular analyses.
- You can filter the history by events and set the start and end dates.
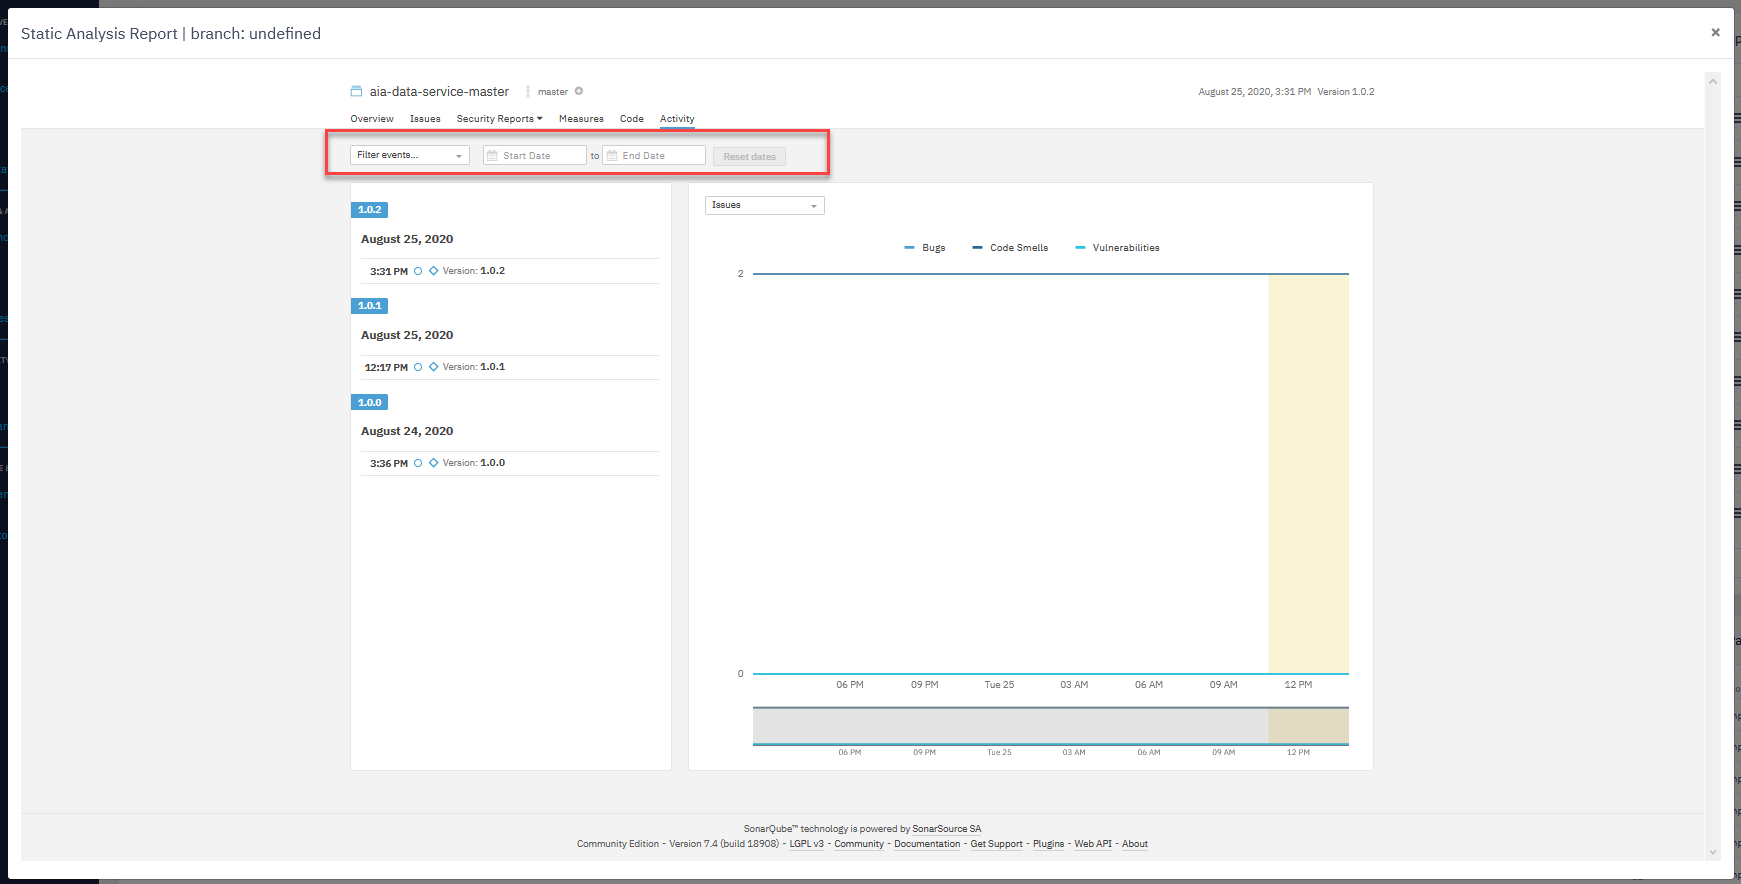
- Choose the type of analysis to see the code and analytics changes related to the specific type on the graph.