Java Spring Boot - Tracing
Tracing is a feature integrated into CodeNOW, which helps you visualize the flow of requests between components in a simple, effective way. Unique trace IDs are generated for every new request. When a component receives the request a new span is assigned for said component, and the span is added to the trace. The traces are then sent to the jaeger collector. You can find more information about the tracing here.
If you decide to create a new application consisting of multiple components using Apache Kafka for asynchronous communication, the tracing doesn't automatically work.
In this tutorial you will learn:
- How to make tracing work for your Spring Boot application.
- How to propagate traceID through Kafka.
- How to visualize DB queries.
- How to create spans manually.
Prerequisites
Dependencies
First, we need to add these dependencies into our pom.xml file.
<dependency>
    <groupId>org.springframework.cloud</groupId>
    <artifactId>spring-cloud-starter-sleuth</artifactId>
    <version>3.0.2</version>
</dependency>

<dependency>
    <groupId>org.springframework.cloud</groupId>
    <artifactId>spring-cloud-sleuth-zipkin</artifactId>
    <version>3.0.2</version>
</dependency>
Configuration
We also need to change the application.yaml configuration file.
- Set the name of the application.
- This application name is then used to see the service name as well as the trace and span IDs.
spring:
    application:
        name: ${NAME_OF_YOUR_APPLICATION}
- Add zipkin and sleuth properties.
- CodeNOW jaeger collector (deploy).
spring:
    zipkin:
        enabled: true
        baseUrl: http://tracing-jaeger-collector.tracing-system:9411
    sleuth:
        propagation:
            type: B3
            tag:
                enabled: true
- Localhost jaeger collector (running locally).
- To run jaeger in your local environment check this.
spring:
    zipkin:
        enabled: true
        baseUrl: http://localhost:9411
    sleuth:
        propagation:
            type: B3
            tag:
                enabled: true
Tracing with Kafka
To enable the propagation of trace IDs through Kafka we also need to add this configuration to the application.yaml configuration file.
spring:
    sleuth:
        messaging:
            kafka:
                enabled: true
Tracing and DB queries
You can visualize any call to the DB by adding an aspect.
This aspect automatically creates a new span for every query in the DB.
- First, we need to add a
TracingHelperclass. This class can create new spans.
package org.example.service.tracing;

import org.springframework.cloud.sleuth.Span;
import org.springframework.cloud.sleuth.Span.Kind;
import org.springframework.cloud.sleuth.Tracer;
import org.springframework.stereotype.Component;

@Component
public class TracingHelper {

    private static final String CLASS = "class";

    private static final String TYPE = "type";

    private final Tracer tracer;

    /**
     * Constructor.
     *
     * @param tracer sleuth tracer
     */
    public TracingHelper(Tracer tracer) {
        this.tracer = tracer;

    }

    /**
     * Create sleuth client span.
     *
     * @param remoteServiceName executed service name
     * @param type tag 'type'
     * @param className tag 'class'
     * @return new tracing span
     */
    public Span createClientSpan(String remoteServiceName, String type, String className) {
        return tracer.nextSpan().tag(TYPE, type)
                                .tag(CLASS, className)
                                .name(remoteServiceName);
    }

    /**
     * Start sleuth client span.
     *
     * @param span span
     * @return new Tracer.spanInScope
     */
    public Tracer.SpanInScope spanInScope(Span span) {
        return tracer.withSpan(span.start());
    }
}
- Now we need to add an aspect to our repository.
- Adding this aspect will cause a new span to be automatically created with every DB query, and it will take care of the whole lifecycle of the created span.
   package org.example.service.tracing;

   import org.aspectj.lang.ProceedingJoinPoint;
   import org.aspectj.lang.annotation.Around;
   import org.aspectj.lang.annotation.Aspect;
   import org.springframework.beans.factory.annotation.Autowired;
   import org.springframework.cloud.sleuth.Span;
   import org.springframework.stereotype.Component;

   @Aspect
   @Component
   public class RepositoryTracingAspect {
       private static final String TRACING_TYPE = "repository";
       private TracingHelper tracingHelper;

       @Autowired
       public RepositoryTracingAspect(final TracingHelper tracingHelper) {
           this.tracingHelper = tracingHelper;
       }

       @Around("within(org.springframework.data.repository.CrudRepository+)")
       public Object traceRepositoryCalls(ProceedingJoinPoint joinPoint) throws Throwable {
           String className = joinPoint.getSignature().getDeclaringTypeName();
           String targetMethod = joinPoint.getSignature().getName();

           Object proceed;

           Span span = tracingHelper.createClientSpan(targetMethod, TRACING_TYPE, className);
           try (Tracer.SpanInScope ws = tracingHelper.spanInScope(span)) {
              proceed = joinPoint.proceed();
           } finally {
               span.end();
           }

           return proceed;
       }
   }
Create spans manually
We can even create new spans manually by using the createClientSpan method from the TracingHelper class.
If we want to create spans manually, we have to take care of the lifecycle of the created span on our own.
Once we have the span created, we need to start it with the spanInScope method from the TracingHelper class.
Every span needs to be ended and because our code could produce some exceptions, we need to wrap it into atry(){} finally{} block as shown below.
- The code can look like this:
   Span span = tracingHelper.createClientSpan("Legacy App 1",
                                               "service",
                                               this.getClass().getName())
   try(Tracer.SpanInScope ws = tracingHelper.spanInScope(span)){
       // Enter your code here
   } finally {
       span.end();
   }
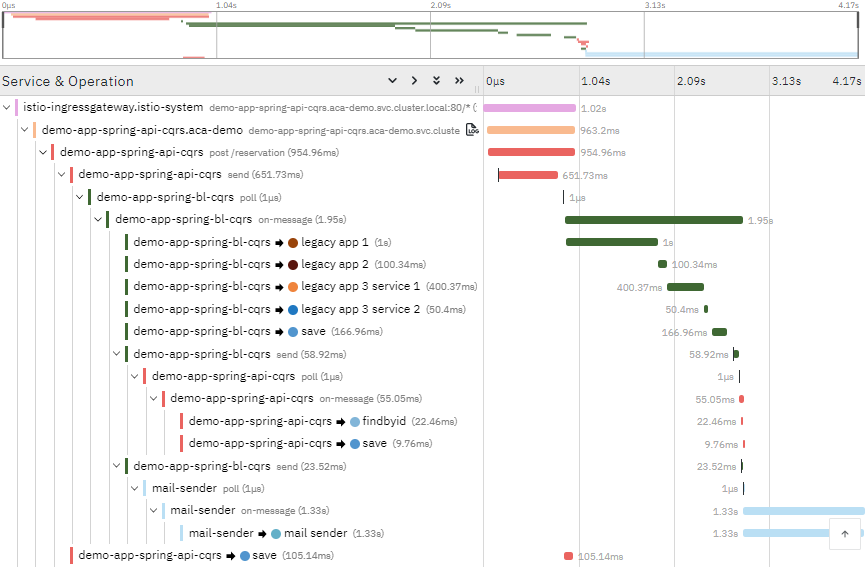
Final trace example
Here is an example of how the final trace could look like after enabling tracing for your application. This particular final trace is from our Demo Ticket Reservation Application.